Skip to content
Home ›
Blog › Customer Experience
How to Measure Customer Effort Score (CES): A Practical Guide to Reducing Friction
Satisfaction isn’t the whole story. The Customer Effort Score (CES) reveals how easy it is for customers to get help—and low-effort experiences are one of the strongest predictors of loyalty. Here’s how to measure CES correctly, interpret it, and use it to remove friction across your support operations.
By CallZent Editorial Team Updated
TL;DR: How to Measure Customer Effort Score
Measuring Customer Effort Score (CES) involves asking customers how easy it was to resolve their issue, typically right after an interaction.
The best practice is to use a 1–7 scale survey (from “Very Difficult” to “Very Easy”) sent via SMS or an in-app pop-up.
To calculate your score, find the average of all responses. A score above 5.0 is good; above 6.0 is excellent.
Segment your data by agent, channel, and issue type to pinpoint operational weaknesses and drive targeted improvements.
- Ask immediately: Post-interaction (SMS, IVR, in-app, chat widget) for the most accurate feedback.
- Use a clear scale: 1–7 works well for benchmarking and trend tracking.
- Calculate simply: Average all responses (or track % of top-box ratings if using agree/disagree).
- Don’t stop at the average: Slice by channel, agent, topic, and customer segment to find friction.
Why CES Is Your Most Important Metric
More than ever, we’re drowning in metrics. We track satisfaction (CSAT), loyalty (NPS), and first-call resolution. But what if the secret to keeping customers isn’t about delighting them with over-the-top service, but simply about not making their lives difficult?
That’s the core idea behind the Customer Effort Score. It shifts the entire focus from “How happy are you?” to “How easy was that?”
This perspective is incredibly powerful. Your customers are busy; they value their time. A high-effort experience—like navigating a confusing phone menu, repeating information to multiple agents, or being transferred endlessly—creates friction. That friction leads directly to churn and higher operational costs from repeat calls. For a foundational understanding, exploring the core principles of the Customer Effort Score (CES) can provide valuable context.

The Proven Link Between Low Effort and High Loyalty
The connection between effort and loyalty isn’t just a theory; it’s backed by data.
Research highlighted in the Harvard Business Review revealed just how predictive CES is. The study found that among customers who reported a low-effort experience, a staggering 94% intended to repurchase. Even more telling, 88% said they planned to increase their spending. These numbers consistently outperform loyalty predictions from traditional metrics like CSAT and NPS.
Key Takeaway: Reducing customer effort is one of the most direct and effective ways to drive customer loyalty and increase lifetime value. It’s not about grand gestures; it’s about delivering smooth, efficient resolutions, every single time.
This principle is exactly why at CallZent, we focus on engineering effortless interactions. We know from experience that a customer who gets their problem solved on the first try with minimal hassle is far more valuable than one who is merely “satisfied” after a long, frustrating ordeal.
How Measuring CES Becomes a Diagnostic Tool
Beyond predicting loyalty, CES is an exceptional diagnostic tool. It shines a bright light on specific points of friction within your customer journey. A low score isn’t just a number; it’s a signal flare that a process, channel, or agent protocol is broken.
Think about these common high-effort scenarios:
- A customer has to switch from your mobile app to a desktop just to complete a purchase.
- An agent lacks the authority to process a simple refund, forcing an unnecessary escalation.
- The IVR menu options don’t match the customer’s actual problem, leading to a dead end.
Each of these represents a point of high effort that a well-timed CES survey can immediately identify. By tracking these scores, you can pinpoint exactly where to invest your resources for the biggest impact, something we explore when defining key customer service performance indicators. This data-driven approach lets you fix the root cause of problems, not just treat the symptoms.
Crafting a CES Survey That Delivers Clear Insights
Your entire Customer Effort Score program hinges on the quality of your survey. A poorly worded question or bad timing will give you useless data. The goal is to make the survey so simple and intuitive that answering it honestly becomes a reflex. It all starts with the question and the scale you use.
Choosing the Right CES Question Format
There’s no single “perfect” way to frame an effort question, but a few formats have consistently proven their worth.
- CES 2.0 (The Modern Standard): This is the one we see most often. It uses a statement with an agree/disagree scale, like: “[Company Name] made it easy for me to handle my issue.” Customers then pick from a 7-point scale, from “Strongly Disagree” to “Strongly Agree.” It’s reliable because it puts the focus on the company’s performance (“you made it easy”).
- The Classic Numeric Scale: The original CES question was more direct: “How much effort did you personally have to put forth to resolve your issue?” This usually gets a 1-5 or 1-7 scale, where 1 is high effort and the top number is very low effort. It still works, but “effort” can be a fuzzy concept for some customers.
- Simple Emoticon Ratings: For lightning-fast feedback in chat widgets or apps, you can’t beat simple happy/sad faces. You trade nuance for a higher response rate, making this format a winner for high-volume, low-stakes touchpoints.
Timing and Channel: The Keys to Relevant Feedback
Asking the right question is just the first step. When and where you ask is just as critical. You need to capture feedback while the experience is fresh in the customer’s mind.
The absolute best time to send a CES survey is immediately after the interaction ends. If you wait even an hour, the accuracy and relevance of the response plummets.
Think about it. A customer just spent 15 minutes on the phone sorting out a billing error. An email survey landing in their inbox the next day is ancient history. The perfect moment is right after the agent hangs up, via an automated SMS or a quick post-call IVR survey.
Here’s a quick guide to matching the channel to the interaction:
| Interaction Type | Best Survey Channel | Why It Works |
|---|---|---|
| Call Center Interaction | Post-call IVR survey or an immediate SMS link | It catches feedback at its most relevant point without making the customer hunt through their email. |
| Live Chat or Chatbot | A pop-up survey within the chat widget upon closing | It’s seamless and contextual. The customer is already right there in that window. |
| Website Self-Service | An on-page pop-up after a task is completed | You can trigger it based on a specific action (like a password reset) for super-direct feedback. |
| Email Support Ticket | An embedded survey directly within the resolution email | This makes it ridiculously easy for the customer to click a rating without ever leaving their inbox. |
When you nail the alignment between the question, timing, and channel, you create a frictionless feedback loop. This doesn’t just boost your response rates; it ensures the data you collect is directly tied to a specific experience—which is what you need for customer feedback for continuous improvement.
Calculating and Interpreting Your CES Data
Once your surveys start bringing in responses, the real work begins. Raw data is just noise; the goal is to turn those numbers into a clear story about your customer experience. Calculating your Customer Effort Score is straightforward. The magic is in how you interpret that score to find the hidden friction points in your operations.
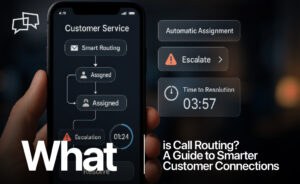
This visualization breaks down the three-step flow for an effective CES survey.

A successful measurement strategy depends equally on what you ask, when you ask it, and where you ask it.
The Basic CES Calculation Methods
The formula you’ll use depends on the survey scale you’ve chosen. Two main approaches cover most scenarios.
- For Numeric Scales (e.g., 1-7): This is just a simple average. Add up the scores from all responses and divide by the total number of responses. For example, if 100 customers respond and their total score is 580, your CES is 5.8.
- For Agree/Disagree Scales: With this format, you’re calculating the percentage of customers who had a low-effort experience. This usually means counting respondents who chose “Agree” or “Strongly Agree” (a 6 or 7 on a 7-point scale), dividing that by the total number of responses, and multiplying by 100.
The specific calculation can vary. As a BPO provider, we often use post-interaction surveys like, “How easy was it to resolve your issue?” on a 1-7 scale for our clients. This lets us quickly calculate an average score and track it in our call center reporting and metrics dashboards.
Looking Beyond the Company-Wide Score
A single, aggregate CES is a decent health check, but it doesn’t tell you where the pain is. The most valuable insights come from segmenting your data. This is how you move from knowing you have a problem to knowing exactly what to fix.
After you’ve collected your responses, the next critical step is analyzing survey data in Excel or a similar tool to pull out meaningful insights.
Think about breaking down your score by different dimensions:
- By Interaction Type: Compare the CES for a billing inquiry versus a technical support call. If billing scores are consistently lower, it’s a clear signal to investigate that department’s processes.
- By Customer Segment: Do new customers find your onboarding process more difficult than established clients? Segmenting by customer tenure or product line can reveal friction points specific to certain groups.
- By Support Channel: Is it easier for customers to get help via live chat than over the phone? A low score on a specific channel might point to issues with IVR complexity or chatbot limitations.
Our Approach at CallZent: We regularly segment CES data by individual agent performance. This isn’t about pointing fingers; it’s about identifying coaching opportunities. An agent with a lower CES might need more training, while a top-performer’s call recordings can be used as a gold-standard training example for the whole team.
This granular approach turns a simple metric into a powerful diagnostic tool, allowing you to make targeted changes that deliver the biggest impact on your overall customer experience.
Benchmarking Your Score and Setting Realistic Goals
So, you’ve calculated your Customer Effort Score. Maybe it’s a 5.2 out of 7. Is that good? Bad? Average?
A single number without context is just noise. To drive real change, you need to benchmark that score and set clear, data-driven goals. This turns a floating metric into a navigational tool that shows you where you stand and where you need to go.
Internal Benchmarking: The Most Important Comparison
The most valuable benchmark is your own historical performance. Your number one goal should always be to make today’s customer experience a little less painful than yesterday’s.
Tracking your CES over time tells the real story. Did your scores tick up after a new agent training program? Did they dip after you rolled out a new IVR menu? This week-over-week or month-over-month comparison is your most accurate indicator of progress.
Understanding Industry Benchmarks
Once you have a solid internal baseline, then you can look outward. Industry benchmarks provide context, helping you gauge if your definition of “low effort” lines up with what customers expect.
As a general rule of thumb for the popular 1-7 scale:
- A score below 5.0 is a red flag, pointing to significant friction in your customer journey.
- A score between 5.0 and 6.0 is often considered solid, competitive performance.
- A score consistently above 6.0 puts you in the top tier of low-effort experiences.
A SaaS company, for instance, might aim for a higher score on its self-service portal than a healthcare provider handling complex insurance claims, where a slightly lower score might still be excellent.
Your most important competitor is your past self. Aim for continuous improvement on your own baseline first, then use industry scores as a compass to ensure you’re heading in the right direction.
Setting Data-Driven and Realistic Goals
Effective CES goals aren’t just arbitrary numbers. They should be tied directly to tangible operational tweaks and business outcomes. This is where your score becomes an active driver of change. A great goal connects CES to other key performance indicators, a concept we cover in our guide to service level agreement metrics and performance.
Here’s a simple framework for setting goals that get results:
- Be Specific: Instead of “Improve CES,” a better goal is, “Increase the CES score for billing-related calls from 4.8 to 5.2 within Q3.”
- Tie It to an Action: Link the goal to a concrete initiative. For example, “Achieve a 5.5 CES for password resets by implementing a one-click reset link in all support emails.”
- Connect to Business Impact: Frame the goal around a business outcome. A powerful goal sounds like, “Boost our overall CES by 0.5 points to reduce repeat calls by 10% this quarter.”
This approach gives your team a clear roadmap, ensuring your efforts to measure customer effort lead directly to a better customer experience and a healthier bottom line.
From Insights to Action: How to Reduce Customer Effort
Measuring your Customer Effort Score is a great start, but the data is useless if it just sits on a dashboard. The real magic happens when you turn those numbers into concrete actions that make life easier for your customers. This is where you connect insights to operations.
It all begins with diagnosing the root causes of high effort. Think of a low CES score as a symptom; your job is to find the disease.
 Pinpointing High-Effort Touchpoints
The quickest way to lift your overall CES is to attack the points of greatest friction first. Your segmented CES data will point you in the right direction, but you have to dig deeper to find the “why.”
Start by mapping the journey associated with a low-scoring interaction. If billing inquiries consistently get terrible CES ratings, walk through every step a customer takes.
- Review Process Flows: Are customers forced to jump between multiple web pages or repeat their account info to different agents? Every handoff is a potential friction point.
- Analyze Call Recordings: Listen to the calls. You’ll hear the frustration firsthand. Are customers complaining about long holds? Are agents scrambling for information?
- Audit Self-Service Channels: Be the customer. Go through your own FAQ pages and chatbot flows. Is the information accurate and easy to find?
This helps you go from a vague problem like “billing is hard” to a specific, fixable issue like “customers can’t find the ‘update payment method’ button.”
Empowering Agents to Be Effort-Reducers
Your frontline agents are your most powerful tool for reducing customer effort. But they can’t do much if they aren’t empowered with the right tools and authority. An agent who has to say, “I need to transfer you to my supervisor for that,” is an agent creating a high-effort experience by design.
Our BPO Philosophy: At CallZent, we build our teams around the principle of empowerment. We equip our agents in Tijuana with extensive training and the authority to make decisions, turning them into problem-solvers, not just script-readers. An empowered agent transforms a difficult interaction into a seamless one.
For example, a healthcare client reduced friction by integrating their systems. Previously, agents couldn’t access patient appointments and billing info in the same place, forcing long holds. By giving agents a unified view, their ability to resolve issues in a single contact shot up, directly boosting their CES.
Optimizing Your Channels and Processes
Once you’ve found the friction and empowered your team, it’s time to refine the processes themselves. This is about removing unnecessary steps and making your systems work for the customer.
A retail client of ours noticed a low CES tied to online returns. The data showed customers were fed up with printing labels and finding a specific shipper. To fix this, they introduced a QR code-based return system. Now, customers just show a code on their phone at a local drop-off point. This one change eliminated several high-effort steps and led to a big improvement in their CES.
Here are a few more proven strategies:
- Simplify Your IVR: Cut down menu options and use natural language processing to understand customer intent faster.
- Enhance Self-Service: Create clear, concise help articles and video tutorials for common issues.
- Streamline Agent Workflows: Give agents everything they need on a single screen to maximize their ability to achieve a positive outcome on the first try, which is central to understanding why first call resolution matters.
Ultimately, reducing customer effort is a continuous cycle of measuring, diagnosing, and acting. By using your CES data as a roadmap, you can systematically dismantle the barriers that frustrate your customers and build lasting loyalty.
Answering Your Top Questions About Measuring CES
When you first start weaving the Customer Effort Score into your CX program, a few questions always pop up. Getting them answered upfront is key to sidestepping common mistakes.
How Often Should We Measure CES?
CES is a transactional metric. You need to send the CES survey immediately after an interaction ends—the second a support call wraps up, a chat window closes, or a customer finishes a task on your site.
Why the rush? You’re capturing the experience while it’s still fresh. If you wait even 24 hours, the feedback gets fuzzy and loses its power. Unlike NPS, which gives a big-picture view of loyalty, CES diagnoses the health of specific touchpoints.
What Is a Good CES?
A “good” score depends on your scale and industry complexity. There’s no universal magic number, but there are solid benchmarks.
- On the popular 1-7 scale (where 7 means very low effort), anything above a 5.0 is a decent starting point.
- High-performers push their scores to 6.0 and above, signaling a truly effortless experience.
The most important benchmark is your own past performance. Your number one goal should be continuous improvement. A score that’s consistently ticking upward is the best sign of success.
Can CES Replace Other CX Metrics Like CSAT and NPS?
No—CES isn’t a replacement for Customer Satisfaction (CSAT) or Net Promoter Score (NPS). Think of it as a crucial part of a powerful trio. Each metric tells a different piece of the customer story.
-
- CSAT is about in-the-moment happiness (“Were you happy with that agent’s help?”).
- NPS measures long-term brand loyalty (“How likely are you to stick around?”).
- CES digs into the ease of the experience (“How hard was it to get your problem solved?”).
Frequently Asked Questions About Customer Effort Score
1. What is Customer Effort Score (CES)?
Customer Effort Score measures how easy it is for customers to resolve an issue or complete a task. Lower effort strongly correlates with higher loyalty.
2. When should a CES survey be sent?
Immediately after the interaction ends—post-call, post-chat, or right after a task is completed.
3. What scale is best for CES surveys?
A 1–7 scale is the most widely adopted because it balances simplicity with actionable insight.
4. What is considered a good CES score?
Scores above 5.0 indicate acceptable performance; scores above 6.0 reflect best-in-class, low-effort experiences.
5. How is CES different from CSAT?
CSAT measures satisfaction, while CES measures ease. A customer can be satisfied but still experience high effort.
6. Can CES predict customer churn?
Yes. High-effort experiences are one of the strongest predictors of customer churn.
7. Should CES be measured for every interaction?
It’s best used for transactional touchpoints like support calls, chats, onboarding steps, and self-service actions.
8. How often should CES results be reviewed?
Weekly for operational teams and monthly for leadership to track trends and improvements.
9. What causes low Customer Effort Scores?
Common causes include long hold times, transfers, unclear processes, limited agent authority, and poor self-service design.
10. How can outsourcing improve CES?
A specialized BPO like CallZent reduces effort through trained agents, better routing, faster resolution, and consistent QA.
Ready to Eliminate Customer Friction?
Low-effort experiences don’t happen by accident—they’re engineered. At CallZent, we help brands design customer support operations that resolve issues faster, reduce repeat contacts, and drive measurable loyalty.
Our nearshore teams in Tijuana combine bilingual expertise, empowered agents, and performance-driven QA to deliver consistently low Customer Effort Scores.
While CSAT tells you what a customer felt and NPS predicts what they might do, CES often reveals the why. A high-effort experience is one of the biggest drivers of churn, even if the customer was technically “satisfied.” To get the full picture, you need all three.
Ready to turn your customer support into a low-effort, loyalty-building machine? At CallZent, we specialize in creating seamless experiences that delight your customers and drive your business forward. Our bilingual, nearshore teams in Tijuana are experts at reducing friction and resolving issues efficiently.
Discover how our tailored call center solutions can elevate your customer experience. Learn more about what we do at CallZent.