Skip to content


Lead Generation & Contact Center Performance
Lead Generation Performance Metrics: From CPL to Profitable Growth
Connect acquisition costs, response speed, qualification, and customer value in a scorecard your marketing, operations, and sales teams can trust.
TL;DR — Quick Takeaways
- Pair CPL with qualified-lead cost, CAC, and mature downstream outcomes.
- Separate attempted outreach from successful contact and show leads still waiting.
- Define every funnel stage, denominator, cost boundary, and measurement window.
- Use margin-based return alongside revenue and attribution measures.
- Keep qualification, language coverage, outreach controls, and handoff ownership visible.
The popular advice to generate more leads at a lower cost is incomplete. A campaign succeeds when your team reaches the right prospects, qualifies their needs, and turns useful conversations into customers at a sustainable acquisition cost. A full inbox alone cannot establish that result.
The most useful lead generation performance metrics connect marketing spend with contact-center execution and downstream sales. Track what each inquiry costs, whether agents can work it, how quickly it receives attention, and what value it eventually creates.
Seven Metrics That Measure Lead Generation Performance
Start with seven measures: cost per lead, customer acquisition cost, conversion rate, speed to lead, MQL-to-SQL elapsed time, customer lifetime value, and return on investment. Add operational measures such as contact rate, cost per qualified lead, appointment attendance, and sales acceptance to explain movement between stages.
Document each numerator, denominator, cost boundary, time window, and owner. A metric named “conversion rate” is ambiguous until you know whether it describes visitors becoming inquiries, inquiries becoming qualified leads, or qualified leads becoming customers.
| Metric | Working formula | How to use it |
|---|---|---|
| Cost per lead (CPL) | Defined lead-generation cost ÷ unique leads generated | Compare acquisition efficiency using the same cost boundary. |
| Customer acquisition cost (CAC) | Total acquisition sales and marketing cost ÷ new customers won | Evaluate full acquisition expense; distinguish period reporting from cohort reporting. |
| Conversion rate | Records completing a defined stage ÷ eligible starting records × 100 | Name the transition, such as visitor-to-lead or lead-to-customer. |
| Speed to lead | Elapsed time from capture to first attempted outreach | Track successful contact separately and retain unattempted leads. |
| MQL-to-SQL elapsed time | Time from marketing qualification to sales qualification | Report median and upper percentiles, plus leads still waiting. |
| Margin-based lifetime value | Revenue per period × gross margin × expected relationship periods | Use as a simplified estimate; validate retention, service costs, and cash timing. |
| Program ROI | (Attributable contribution before acquisition cost − acquisition program cost) ÷ acquisition program cost × 100 | Separate profit-based return from revenue-to-spend measures. |
There is no universal CPL or conversion target that makes every campaign profitable. Industry, geography, sales cycle, offer, lead definition, and channel all affect the comparison. Use external benchmarks only when their definitions and audience match your operation.
How to Calculate CPL, CAC, and Cost per Qualified Lead
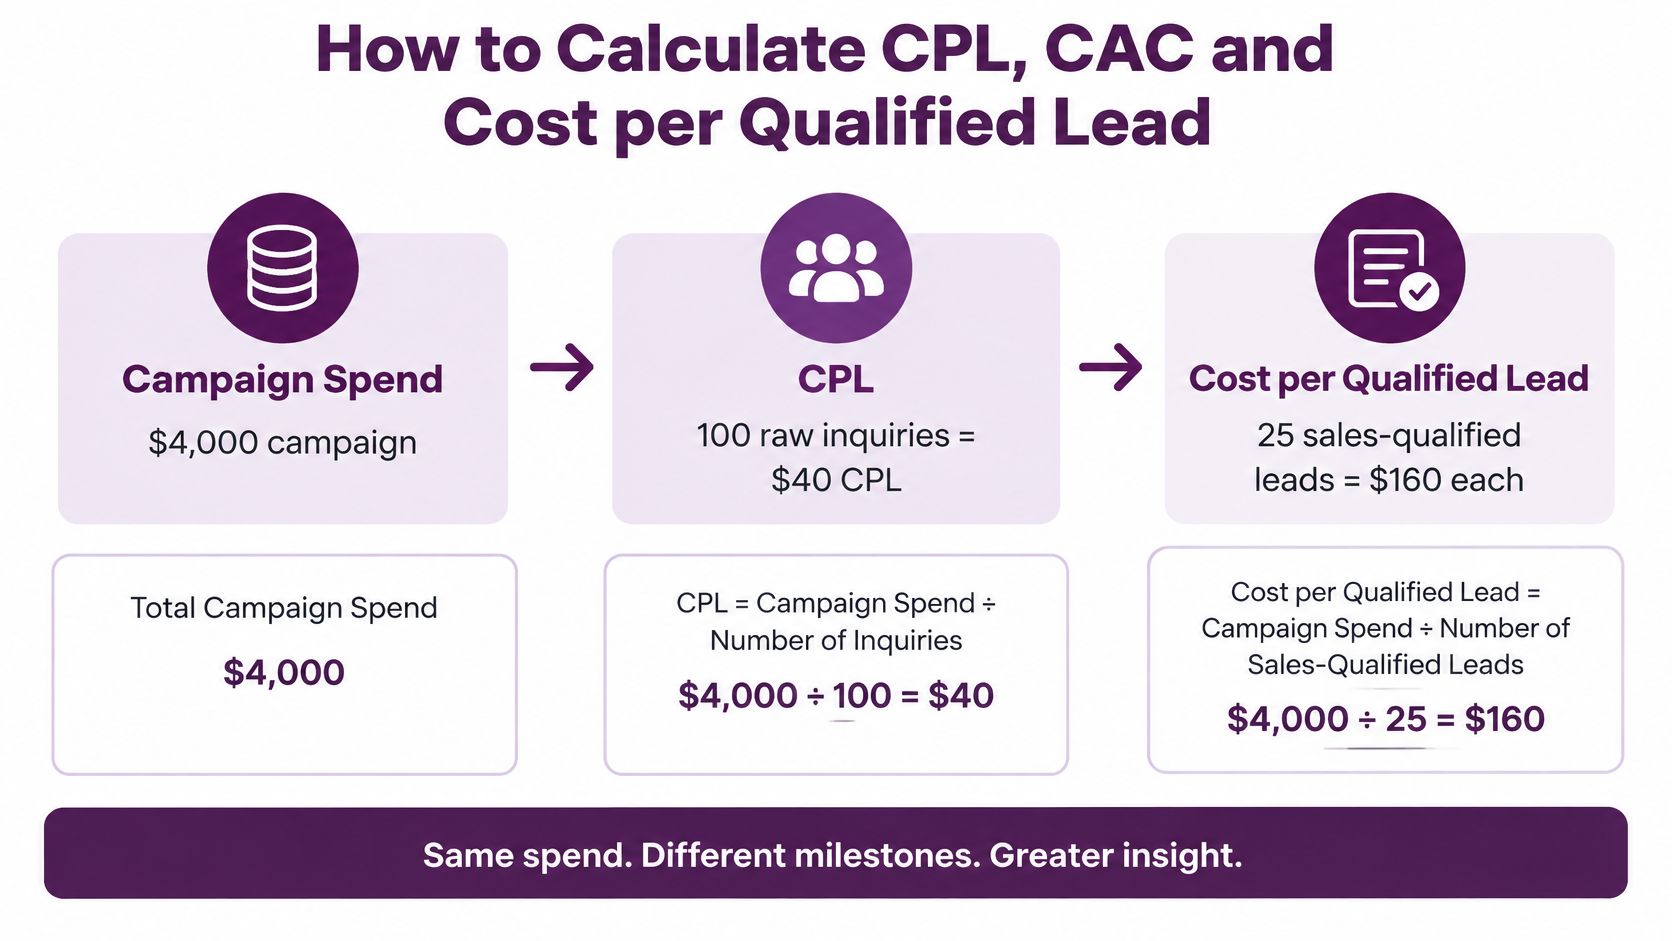
Suppose a campaign spends $4,000 and generates 100 unique inquiries. CPL is $40. If 25 inquiries qualify under agreed rules, cost per qualified lead is $160. These are hypothetical calculations, not CallZent prices or performance promises.
A raw inquiry and a qualified sales conversation are different deliverables. Comparing vendors only on raw CPL can reward the one that performs less screening while transferring more work to your team.
Use a Consistent Cost Boundary
CPL = defined lead-generation cost ÷ unique leads generated.
Cost per qualified lead = the same defined cost ÷ leads meeting qualification criteria.
CAC = total acquisition sales and marketing cost ÷ new customers won.
Label media-only CPL separately from fully loaded lead-generation cost. Include relevant agency fees, qualification labor, outsourcing fees, technology, and sales expense in the appropriate acquisition calculation. Reconcile shared costs through a documented allocation method, and count each expense once.
A monthly CAC report is useful for budgeting, but spending this month may produce customers several months later. Maintain acquisition cohorts alongside period reporting so sales-cycle timing does not disguise performance.
Compare Sources on the Same Terms
- Define an accepted lead. Establish identity, duplication, service-area, and other acceptance rules.
- Define qualification. Specify needs, fit, readiness, and required information for the next stage.
- Reconcile spending. Show media, labor, tools, and provider fees separately.
- Report raw and qualified costs together. Investigate inexpensive inquiries that become expensive after screening.
- Keep rejected records visible. Report duplicate, invalid, and out-of-scope shares instead of silently removing acquisition waste.
Buying rule: Agree on what the supplier delivers and what your team must still do before negotiating a lower price per lead.
Measure Speed to Lead Without Hiding the Waiting
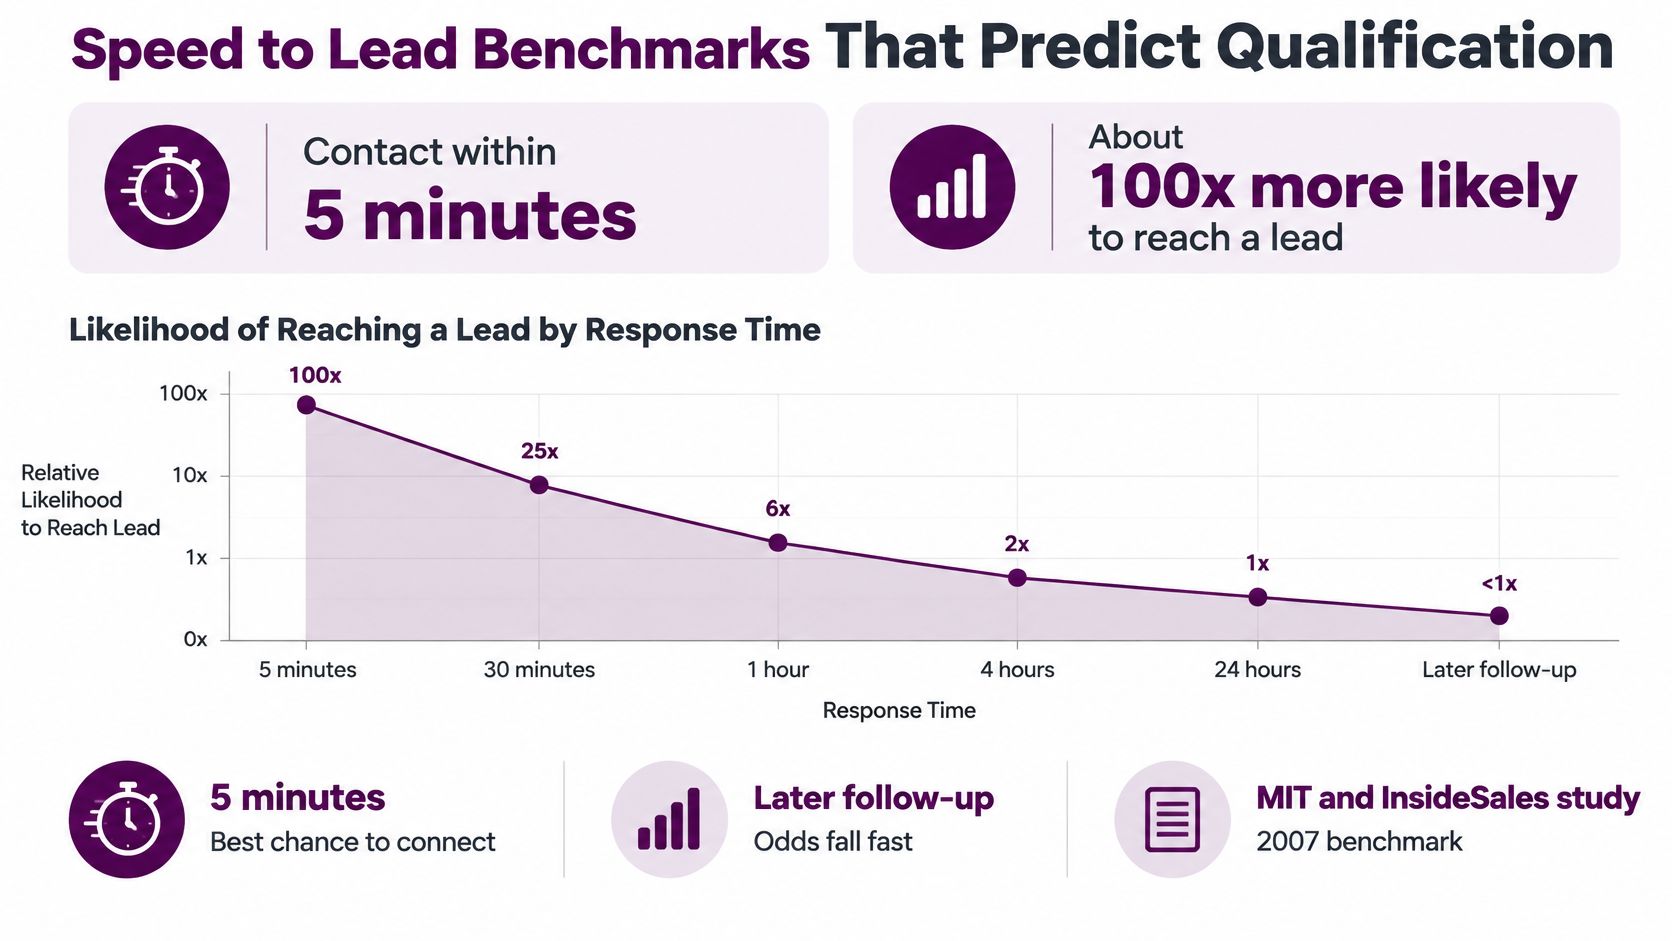
Fast follow-up matters operationally because a prospect who requests information needs a clear next step. Set response commitments around customer intent, published hours, available staffing, and permitted outreach. A five-minute first-attempt target may suit a staffed, high-intent queue, but it is an illustrative operating choice rather than a universal sales benchmark.
Separate capture, routing, assignment, first attempt, and successful contact timestamps. An automated receipt confirms submission; an unanswered call records an attempt. Neither proves that an agent reached the prospect or qualified a need.
Use Response Buckets to Find Delays
| Illustrative first-attempt bucket | What to inspect | Reporting safeguard |
|---|---|---|
| Within 5 minutes | Routing, ownership, and available agent capacity | Compare qualification and sales outcomes; do not assume speed caused them. |
| More than 5 to 60 minutes | Queue aging, breaks, and handoff delays | Use exact boundaries so records appear in one bucket only. |
| More than 1 to 24 hours | Coverage gaps and unresolved assignments | Separate business-hours targets from total elapsed customer waiting. |
| More than 24 hours | Backlog, integration failure, or missed follow-up | Assign an owner and retain the original capture timestamp. |
| No attempt recorded | Unassigned or unworked demand | Keep these leads in the coverage denominator. |
Report median and 90th-percentile first-attempt time among attempted leads, alongside the share attempted within target and the count still waiting. The 90th percentile is the time at or below which about 90% of measured records fall; it is not the average of the slowest 10%.
For English-Spanish programs, compare response coverage by source, language, and shift. An overall average can hide a Spanish-language routing gap. The operating questions in our B2B lead generation outsourcing guide help establish handoff ownership before launch.
Separate Form Conversion From Workable Demand
A landing-page conversion rate measures the share of a defined audience completing an action. Choose sessions, users, or another valid denominator and keep it consistent. If you report qualified traffic separately from all traffic, label both views rather than changing the denominator without notice.
The following example uses hypothetical rates to show the arithmetic. Neither rate is an industry standard or a recommended target.
| Illustrative scenario | Sessions | Form conversion rate | Submissions |
|---|---|---|---|
| Starting page | 2,000 | 5% | 100 |
| Test variation | 2,000 | 8% | 160 |
| Arithmetic difference | Same session volume | 3 percentage points | 60 additional submissions |
Those 60 additional submissions have commercial value only if enough are unique, contactable, qualified, and likely to buy. A higher completion rate can increase handling costs without increasing profit.
Measure the Full Effect of a Form Change
- Submission rate: Completed forms divided by the documented traffic denominator.
- Data validity: Unique records with usable contact information divided by submissions.
- Contact success: Unique prospects reached divided by the defined lead cohort.
- Qualification and sales: Downstream outcomes for the same acquisition group.
Test a shorter form or callback offer with a stated hypothesis, comparable traffic, and an observation period appropriate to the sales cycle. Where feasible, use randomized testing and avoid changing several unrelated elements simultaneously. Review performance benchmarking alongside contact-center execution so a page improvement is not confused with a staffing change.
Connect Lead Quality, Pipeline Movement, and Customer Value
More volume can make performance worse when agents receive records they cannot use. Build a source-level funnel that follows unique prospects from capture through contact, qualification, booking, attendance, sales acceptance, opportunity, and customer. Not every business needs every stage; every reported stage needs a clear entry rule.

Report the Denominator Beside the Rate
Contact rate can use reached prospects divided by all accepted leads. Qualification rate may use qualified prospects divided by reached prospects. Both are useful, but they describe different transitions. Include total counts so a strong percentage based on very few records does not receive disproportionate weight.
For appointment-setting programs, separate booked meetings from attended meetings and sales-accepted opportunities. Define how reschedules, cancellations, and meetings not yet due affect show rate. A filled calendar alone does not establish pipeline quality.
MQL-to-SQL elapsed time shows how long leads take to move from marketing qualification to sales qualification. Report the median, upper percentiles, and age of leads still in MQL status. An average calculated only from promoted leads can look healthy while stalled records accumulate.
Work Backward to an Affordable CPL
A simple margin-based estimate is average revenue per customer per period × gross margin × expected relationship length in matching periods. Our guide to measuring customer lifetime value provides additional context. Label revenue-based and margin-based estimates clearly, and consider retention uncertainty, service costs, cash timing, and overhead before setting an acquisition budget.
Maximum affordable CPL = (allowable CAC − other acquisition cost per customer) × raw-lead-to-customer close rate.
For example, an allowable CAC of $250, other acquisition cost of $50 per customer, and a 5% raw-lead close rate imply a maximum CPL of $10: ($250 − $50) × 0.05. This simplified hypothetical assumes consistent cost boundaries and a sufficiently mature cohort.
If CPL includes qualification labor, do not subtract that labor again. For a provider charging per SQL, use the SQL-to-customer rate instead of the raw-inquiry close rate. A calculated ceiling is a planning constraint, not a guarantee of profitable scale.
Distinguish ROI From ROAS
ROAS = attributed revenue ÷ advertising spend. It describes advertising revenue relative to media cost and does not establish profit. A revenue-to-total-acquisition-cost ratio should be labeled separately if its cost boundary includes more than advertising.
For a simplified profit-based program return, use (attributable contribution before acquisition cost − acquisition program cost) ÷ acquisition program cost × 100. Match the return and cost to the same cohort and horizon, account for refunds, and avoid counting acquisition expense twice.
For example, $12,000 in revenue at a hypothetical 60% contribution margin before acquisition cost yields $7,200. Subtracting $4,000 in acquisition program cost gives a return of 80%. The 3× revenue-to-program-cost ratio tells a different story from the margin-based return; neither proves the campaign caused every attributed sale.
Diagnose the Stage Where Performance Changed
Start with the stage where results deteriorated rather than assuming that marketing supplied bad leads or agents failed to follow up. The same symptom can have several causes.
| Symptom | Possible explanation | First investigation |
|---|---|---|
| Low contact rate and slow outreach | Routing, coverage, invalid data, or missed assignments | Timestamp distribution, waiting records, and contact validity |
| Healthy contact but weak qualification | Audience fit, misleading offer, screening rules, or agent execution | Source-level rejection reasons and interaction reviews |
| Qualified leads but few bookings | Calendar availability, unclear value, or follow-up gaps | Booking attempts, available slots, and objections |
| Booked meetings but poor attendance | Weak confirmation, confusing expectations, or low intent | Reminders, reschedules, and completed meeting cohorts |
| Slow MQL-to-SQL progression | Scoring rules, ownership gaps, or genuinely longer buying cycles | Stage age, pending records, and sales acceptance criteria |
If Spanish-language contact rate falls after a routing change while English results remain stable, investigate language assignments and coverage. That is a useful hypothesis, not proof of causation. Validate it against logs, source mix, sample size, and interaction quality before reallocating budget.
Assign every corrective action to a named owner with a review date. Record what changed and compare similar cohorts so a seasonal shift or a different audience is not mistaken for the effect of your intervention.
Track Leads Without Double Counting
Google Analytics’ lead acquisition documentation describes new, qualified, and converted lead metrics using unique users triggering the corresponding lead events. These counts reflect your event implementation; an event name alone does not verify a qualified opportunity or completed sale.
In a hypothetical report with 1,000 users and 80 users triggering the lead event, the user lead rate is 8%. If 12 trigger a correctly implemented converted-lead event, that is 12 converted users, not 80 sales.
Reconcile Analytics With CRM Outcomes
Use stable internal CRM identifiers to connect repeat submissions, callbacks, appointments, and purchases. Preserve activity history without automatically creating a new acquired lead for each interaction. Distinguish a person, account, opportunity, and order when your business can have several of each.
Analytics users may not map perfectly to CRM people across devices, consent choices, and identity settings. Reconcile differences instead of forcing totals to match. Keep personal and sensitive information out of analytics event parameters, and use approved identity, access, and retention practices.
Our guide to the lead generation process in BPO helps frame where capture ends, operational ownership begins, and a sales handoff becomes complete.
Treat Attribution as Evidence
Last-touch attribution credits the final observable touch; multi-touch models distribute credit across recorded interactions. Neither automatically measures incremental demand. Pair attribution with CRM outcomes, customer-reported sources, mature cohort value, and controlled incrementality tests where practical.
English and Spanish interactions should remain connected to the same appropriate record. A language change does not make a prospect a new person. When evidence is incomplete, report the uncertainty rather than assigning every sale to the easiest channel to measure.
Put Outreach Controls Beside Commercial Performance
A low-cost record is not workable simply because a supplier labels it compliant. Establish applicable permission, suppression, calling-window, disclosure, and recordkeeping rules before launching outreach.
The FTC’s Telemarketing Sales Rule guidance explains relevant disclosure and do-not-call obligations, with scope and exemptions that must be assessed. The FCC’s TCPA discussion addresses consent requirements for specified calling technologies and destinations. A submitted form is not blanket authorization for every channel or method.
Have the responsible legal or compliance team validate current federal and state requirements for your audience, technology, channels, and jurisdictions. The following dashboard is an operational control framework, not a complete legal compliance checklist.
| Control metric | Definition to document | Action signal |
|---|---|---|
| Required-evidence completeness | Records with required permission or other authorization evidence ÷ records requiring it | Missing evidence must be resolved before outreach that depends on it. |
| Suppression screening coverage | Applicable records screened under the approved policy ÷ records requiring screening | Unscreened dialing or failures to apply internal opt-outs. |
| Opt-out processing time | Elapsed time from receipt to effective suppression across relevant systems | Missed applicable deadlines or continued prohibited outreach. |
| Complaint rate | Unique complaints per 1,000 defined contacts, by campaign and channel | A rise requiring investigation of sourcing and agent behavior. |
| Invalid-contact rate | Invalid or disconnected contact records ÷ assessed records | Poor source quality, stale data, or validation gaps. |
For consent-dependent outreach, attach the required evidence to the record, including its scope and source. A high evidence-completeness percentage does not prove the underlying permission is valid. Investigate complaints and suppression failures even when sales results look strong.
Build a Shared Lead Generation Scorecard
Marketing, operations, sales, finance, and the program’s compliance owner should agree on the same records, stage definitions, timestamps, and cost boundaries. Without that agreement, a successful acquisition report can coexist with an unworkable sales queue.
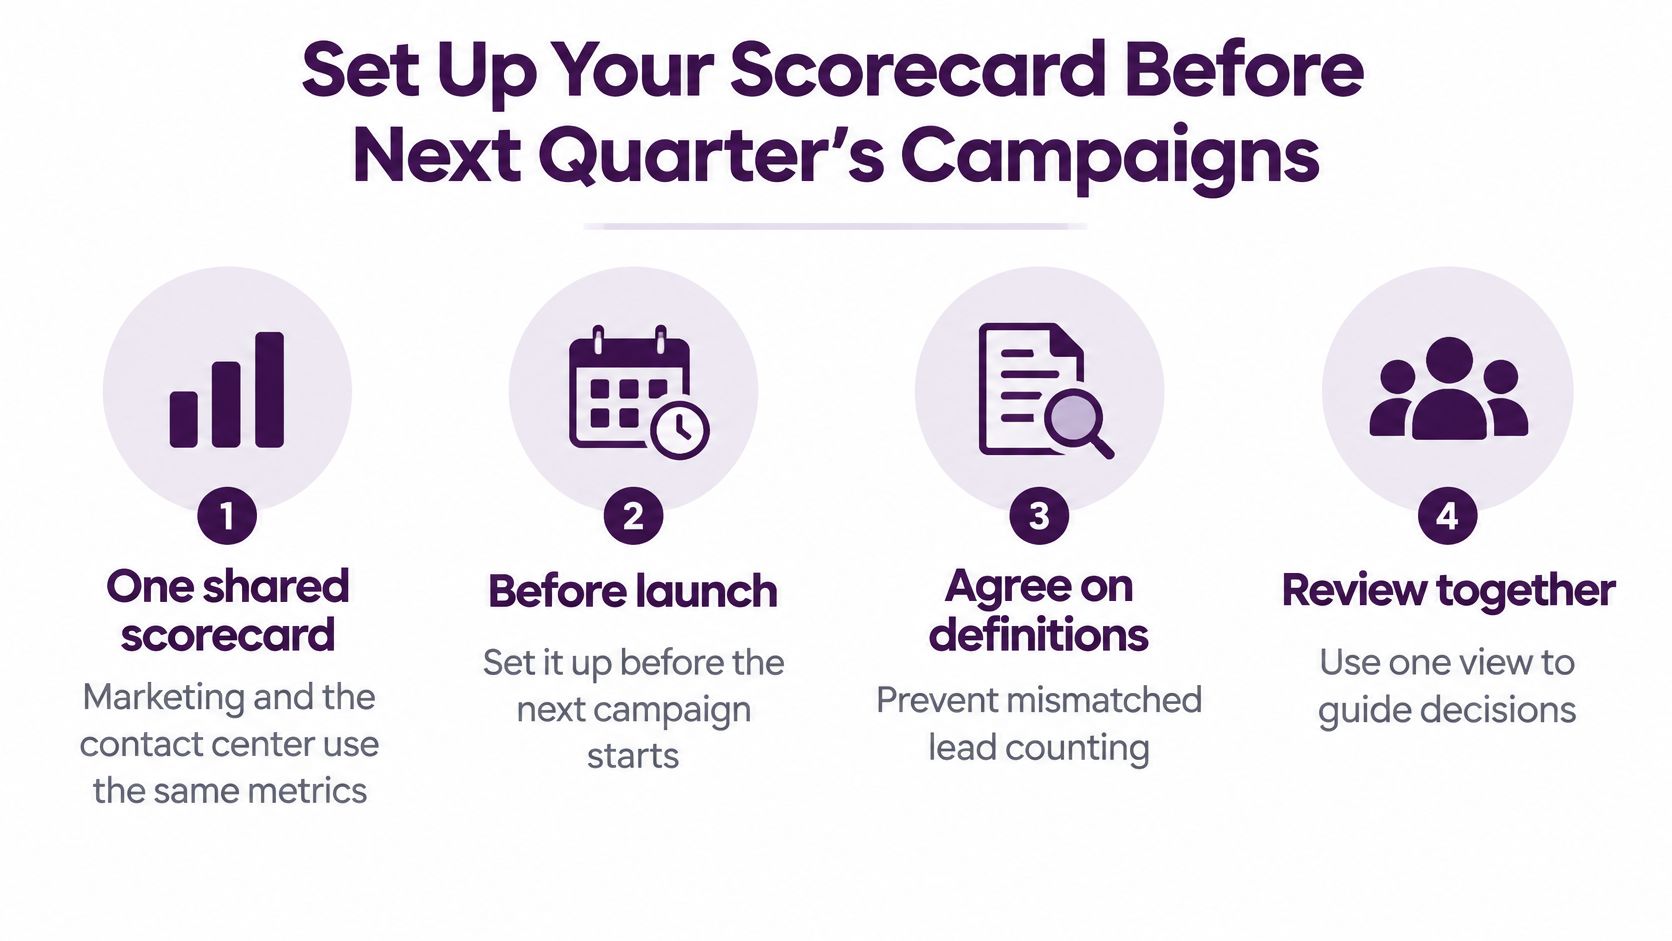
- Document stages and ownership. Define acceptance, qualification, booking, opportunity, and customer outcomes.
- Set realistic response commitments. Report first attempts, successful contact, and leads still waiting.
- Keep costs comparable. Show media-only and fully loaded measures with clear allocation rules.
- Connect cohorts to value. Follow conversion, contribution, refunds, and maturity over time.
- Review quality and controls. Include rejection reasons, permission evidence, suppression, and complaints.
- Assign improvements. Record a hypothesis, owner, effective date, and evaluation window.
Review operational exceptions frequently enough to act, and conduct broader commercial reviews on a cadence that fits your sales cycle. Keep definitions stable where possible. When a necessary rule changes, record the date and separate affected cohorts.
Define the Handoff Before Adding Capacity
When discussing a lead-generation program with CallZent, bring your funnel report, volume patterns, languages, coverage requirements, qualification criteria, and sales handoff rules. Agree on agent responsibilities, training, systems access, reporting, and the results that count as a successful handoff.
Bilingual capacity can support timely English-Spanish prospect engagement, but additional agents cannot repair an unclear offer or missing sales ownership alone. Start with one measurable gap, pilot a defined workflow, and assess qualified conversations and downstream outcomes before scaling.
Frequently Asked Questions
What are the most useful lead generation performance metrics?
Start with CPL, CAC, conversion rate, speed to lead, MQL-to-SQL elapsed time, customer lifetime value, and program ROI. Add contact rate, cost per qualified lead, show rate, and sales acceptance to explain where the funnel gains or loses value.
What is the difference between CPL and cost per qualified lead?
CPL divides the defined acquisition cost by unique leads generated. Cost per qualified lead divides the same cost by leads meeting agreed qualification rules. Report both using the same cohort and cost boundary so screening expense and rejected demand remain visible.
What is a good cost per lead?
A sustainable CPL depends on customer contribution, allowable acquisition cost, downstream close rate, and other acquisition expenses. Compare channels with matching definitions and mature outcomes rather than adopting a broad industry average as a buying target.
How should a contact center measure speed to lead?
Record capture, routing, assignment, first attempted outreach, and successful contact separately. Report first-attempt percentiles, target attainment, unattempted records, and waiting age. Distinguish business-hours commitments from total elapsed waiting.
Is a five-minute response target required for every campaign?
No. Five minutes can be an illustrative first-attempt target for a staffed, high-intent queue. Choose commitments that reflect customer intent, coverage, applicable outreach rules, and operational capacity. Test outcomes rather than treating the target as a guaranteed sales uplift.
How do you calculate the maximum affordable CPL?
Subtract other acquisition cost per customer from allowable CAC, then multiply the remaining amount by the raw-lead-to-customer close rate. Match the close rate to the purchased lead stage and count each expense once. Validate assumptions against a mature cohort.
How does ROI differ from ROAS?
ROAS compares attributed revenue with advertising spend. ROI evaluates a defined net return against investment cost. For a simplified profit-based acquisition return, subtract acquisition program cost from attributable contribution before that cost, then divide by program cost. Define the horizon and avoid double counting.
How can teams prevent duplicate leads?
Use stable internal CRM identifiers and documented rules for people, accounts, opportunities, and orders. Link repeat forms, calls, and reschedules as activities when appropriate. Reconcile analytics and CRM totals without assuming a browser user always represents one identifiable person.
Which outreach controls belong on a lead generation dashboard?
Track required-evidence completeness, suppression screening coverage, opt-out processing time, complaint rate, and invalid-contact rate. Have the responsible compliance team define applicable requirements. Documentation coverage alone does not prove valid permission or complete compliance.
How can a bilingual outsourcing partner improve lead reporting?
A properly scoped partner can document outreach, qualification, language preference, and handoffs using agreed systems and definitions. Confirm training, access, coverage, quality reviews, and reporting responsibilities. Evaluate downstream outcomes during a pilot rather than assuming added capacity automatically improves conversion.
Bilingual Nearshore Support in Mexico
Build a Lead Generation Program You Can Measure
Bring your funnel, qualification rules, language needs, and response gaps to CallZent. Define a bilingual prospect engagement program with clear handoffs and useful performance reporting.