

Workforce Management
Shrinkage Factor Calculation
Learn how to calculate the shrinkage rate and factor, gross up staffing, build the formulas in Excel, and improve contact-center workforce planning.
A planner can schedule what looks like enough people and still miss service-level targets. The usual reason is simple: paid hours aren’t the same as productive hours. Agents may be in training, taking approved leave, attending meetings, waiting for a system to recover, or unavailable because of absence.
Shrinkage factor calculation turns that lost capacity into a planning input. Once you separate the shrinkage rate, a percentage, from the shrinkage factor, a multiplier, you can convert forecast demand into a roster that reflects real operating conditions.
TL;DR — Quick Takeaways
- Shrinkage measures paid time when agents are unavailable to handle customer contacts.
- The shrinkage rate is a percentage; the shrinkage factor is the multiplier used to gross up staffing.
- Calculate the factor with 1 ÷ (1 − shrinkage rate), not by simply adding the rate to headcount.
- At 30% shrinkage, the factor is approximately 1.43, so 60 productive hours require about 86 scheduled hours.
- Track training, PTO, meetings, breaks, sickness, downtime, late arrivals, and other paid non-contact time separately.
- Review shrinkage by interval, team, skill, and site instead of relying on one annual average.
What Shrinkage Means in a Contact Center
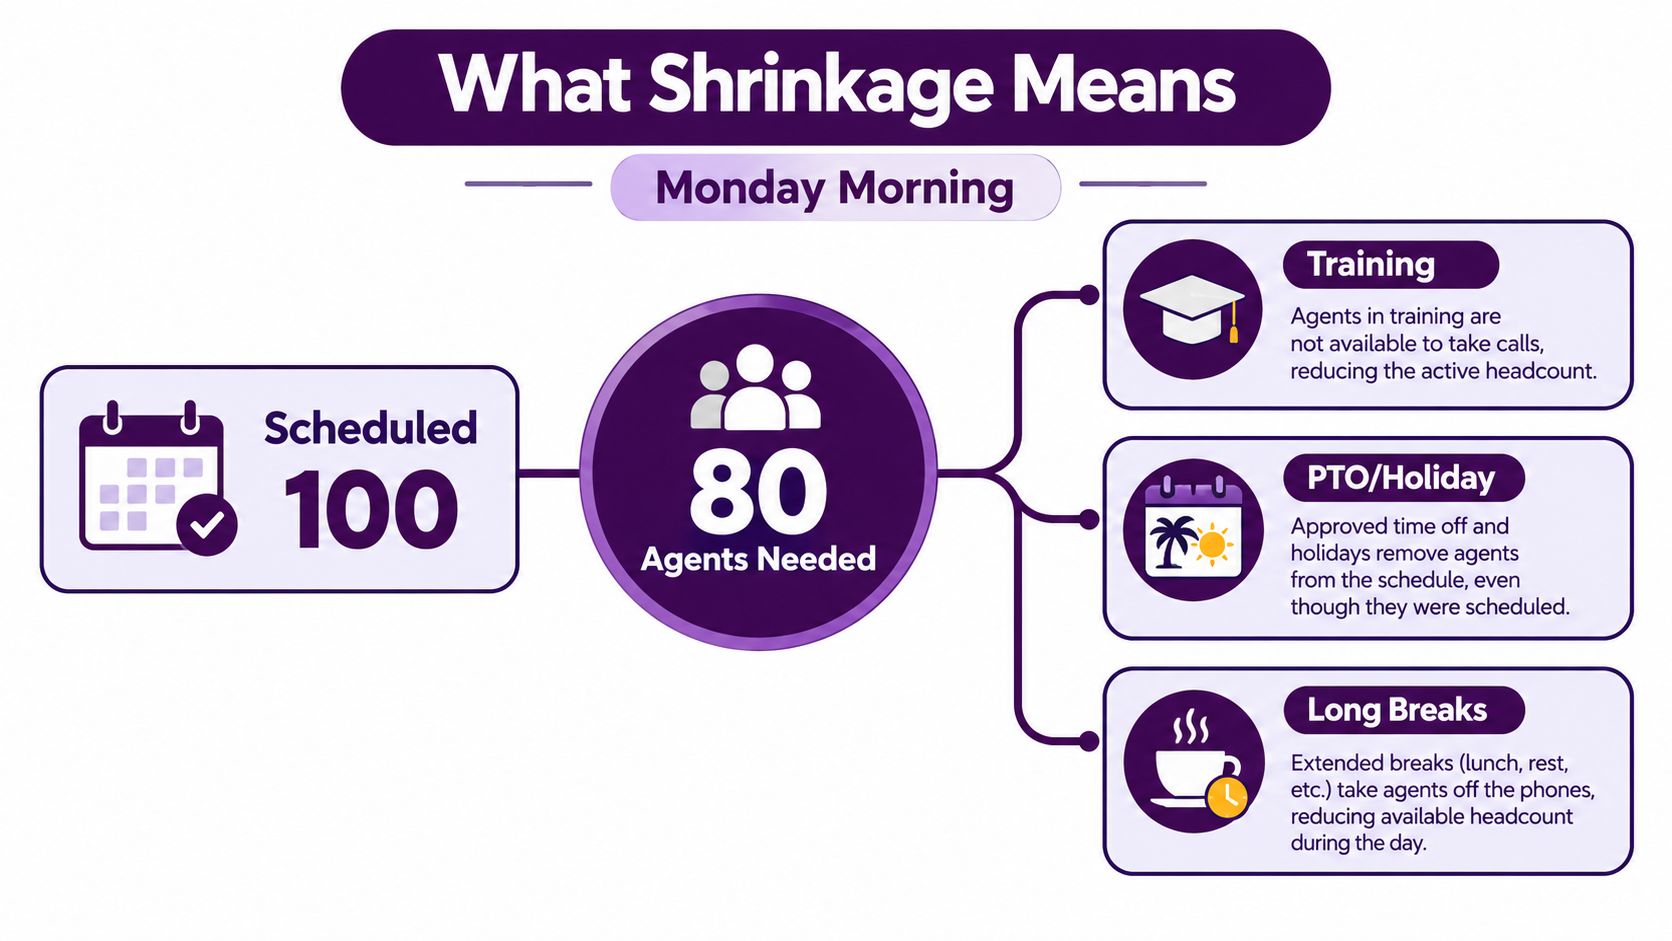
A Monday forecast calls for 80 agents to handle expected contacts. The planner schedules 100, yet the queue still grows. Some agents are in training, others are on holiday or paid time off, and breaks do not always occur exactly as scheduled. The roster counted employees who were paid, not the people available to handle contacts during each interval.
Contact-center shrinkage is paid time when agents are unavailable for customer contacts. The standard definition and shrinkage formula expresses it as non-productive paid time divided by total paid time. A scheduled agent can therefore appear in the workforce plan while contributing no contact-handling capacity at a particular moment.
That distinction shapes the staffing decision. The shrinkage rate is the percentage of paid time that is unavailable. The shrinkage factor is the multiplier used to convert productive demand into paid headcount. Keeping those terms separate prevents a planner from adding a rate directly to staffing and understating the people needed for coverage.
What belongs in the shrinkage bucket
List every paid activity that removes an agent from contact handling:
- Breaks and lunches: Rest periods reduce interval-level availability.
- Vacation and holidays: Planned time away removes capacity from the roster.
- Training: Onboarding, product, compliance, and systems sessions take agents out of the queue.
- Meetings and huddles: Briefings, updates, and operational meetings consume paid hours.
- Coaching and one-to-ones: Quality reviews and development conversations support performance without handling contacts.
- Absenteeism: Unscheduled sickness and other absences reduce actual attendance.
- Late arrivals and early departures: The schedule may promise coverage that never appears.
- Technical downtime: An outage can leave an agent paid but unable to work contacts.
- Voluntary time off: Approved time away still reduces available capacity.
These categories require different management actions, but they create the same planning problem. Each unavailable hour must be recorded before demand is converted into scheduled headcount. Training, coaching, and breaks are not operational failures. They support quality, capability, and sustainable work. The error is treating those hours as contact-handling capacity.
Planning takeaway: A staffing plan must show both productive time and shrinkage. The rate describes the loss, while the factor adjusts the roster for it.
For a practical view of the people and roles behind capacity planning, review CallZent’s call center agents. The useful question is whether the WFM plan measures shrinkage by category, interval, and team, then reflects those values in schedules and service-level expectations.
The Two Formulas Every Planner Needs
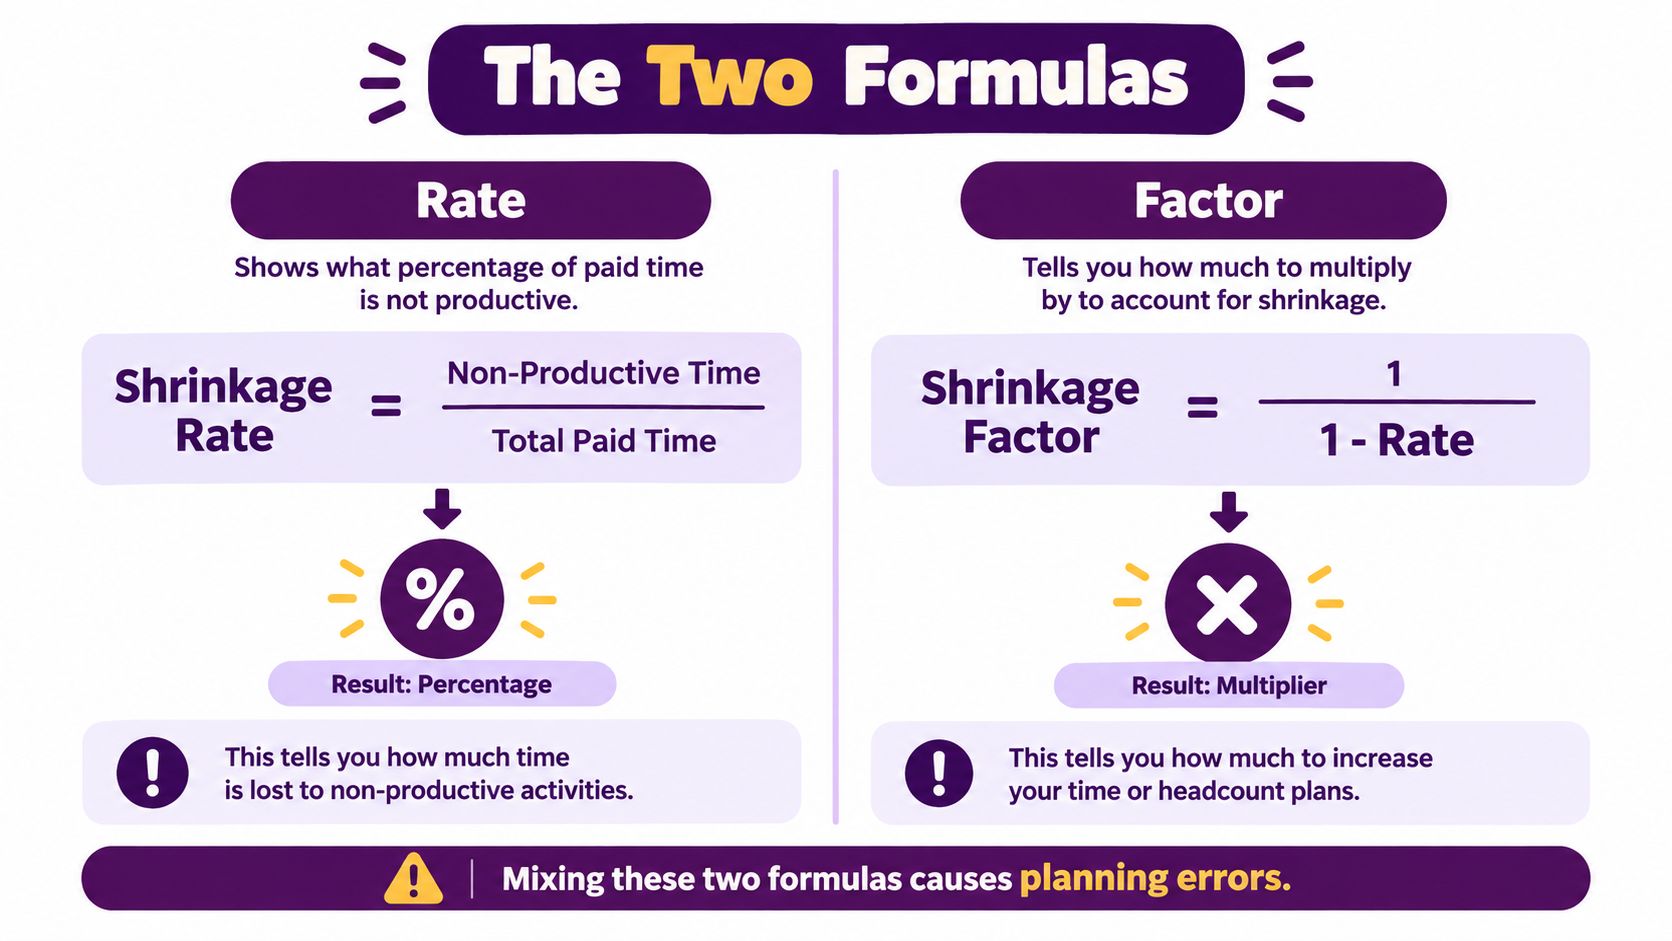
The most common mistake in shrinkage planning is treating the rate and the factor as interchangeable. They aren’t. The rate tells you what share of paid time is unavailable. The factor tells you how much paid capacity you need to cover productive demand.
Start with the shrinkage rate
Use the same unit on both sides of the calculation, either hours or minutes:
Shrinkage Rate = (Non-Productive Time ÷ Total Paid Time) × 100
If a team records non-productive time across its paid schedule, divide that total by all paid time in the planning period. The result is a percentage. The contact-center shrinkage calculation guide describes the same sequence, including the distinction between external shrinkage, such as sickness and holidays, and internal shrinkage, such as coaching and training.
A rate of 30% means 30% of paid time isn’t available for contacts. It does not mean you should add 30% to the base staffing requirement.
Convert the rate into a factor
The productive share is what remains after shrinkage:
Productive Share = 1 − Shrinkage Rate
Then calculate the inverse:
Shrinkage Factor = 1 ÷ (1 − Shrinkage Rate)
At a 30% shrinkage rate, the calculation is:
1 ÷ 0.70 = 1.4286
Rounded for planning, that is about 1.43 paid hours for every productive hour. The factor is larger than the rate because grossing up requires you to divide by the remaining productive share, not add the unavailable share to demand.
The relationship is straightforward:
Non-Productive Time → Shrinkage Rate → Shrinkage Factor → Scheduled Headcount
Keep the calculation grounded in your own paid-time and availability records. External workforce-planning references can provide useful context, but the factor should reflect the operating patterns of your team, queues, schedules, and service requirements.
Apply the factor to demand
Once you have the factor, use the gross-up formula:
Required Headcount = Productive Headcount × Shrinkage Factor
The equivalent form is:
Required Headcount = Productive Headcount ÷ (1 − Shrinkage Rate)
Don’t divide by the shrinkage rate. Dividing by 0.30 answers a different question and produces an inflated result with no planning meaning. Subtract the rate from one first, then divide the productive requirement by the remaining share.
A useful KPI framework can help you track the related measures, including service level, occupancy, adherence, and absence. CallZent’s best call center KPIs resource is a relevant starting point for connecting shrinkage with the rest of your operating dashboard.
Worked Examples for One Agent and a Whole Team
A planner usually trusts shrinkage only after it works in a real staffing decision. Start with one agent to see the math on a single schedule, then move to a team to see how the factor changes coverage, headcount, and service outcomes.
An individual paid week
Use a simple yearly baseline: a 40-hour workweek and 2,080 paid hours per year. If 555 hours disappear into non-productive activities, the shrinkage rate works out to approximately 27%.
That leaves 73% productive time. If the operation needs 23 productive “bodies in chairs,” the schedule requirement is not 23 plus 27%. It is:
23 ÷ 0.73 = 31.5 scheduled staff
The decimal is less important than the planning logic. The percentage shows how much time is lost. The factor shows how much paid capacity must be scheduled so the productive requirement still holds after those losses. New operations managers often mix those up and underbuild the roster, then wonder why adherence and service level slip even when the forecast looked right.
A team-level staffing decision
A team forecast starts from productive demand hours. By that point, the planner has already considered volume, average handle time, occupancy, and the interval shape of demand. That number is the net requirement before shrinkage.
If team shrinkage is 30%, the planner applies the 1.43 factor to the base requirement. A demand of 60 productive hours therefore needs approximately 85.7 scheduled hours, normally rounded to 86 scheduled hours.
60 ÷ 0.70 = 85.7 scheduled hours
The underlying gross-up method is also explained in Fini’s shrinkage factor explanation.
That grossed-up figure is the schedule target. It covers the gap between the work forecast and the time agents can spend on contacts. The same logic applies to a small in-house team and to a larger BPO operation.
| Input | Single Agent, Weekly | Team of 50, Monthly |
|---|---|---|
| Planning unit | Paid hours | Productive demand hours |
| Starting point | 40-hour workweek | Forecast volume, AHT, and occupancy |
| Shrinkage treatment | Remove unavailable paid time | Apply the team-level inverse factor |
| Planning output | Productive share of paid time | Gross scheduled capacity |
| Main risk | Confusing attendance with availability | Using one average for every interval |
Both examples point to the same rule. Paid time has to be grossed up to protect productive coverage. The difference is in the evidence used to build the plan. An individual example shows what happens inside one schedule. A team model also has to account for volume timing, skills, queues, breaks, adherence, and shrinkage that concentrates in specific intervals.
Practical rule: Use individual records to understand the causes, but use team and interval data to make the staffing decision.
Building the Calculation in Excel or Google Sheets
A reliable spreadsheet should make the inputs visible. Don’t bury shrinkage inside a single hard-coded percentage that nobody can audit. Build the calculation so a planner can change a category, refresh the factor, and see the staffing model respond.
Create the input sheet
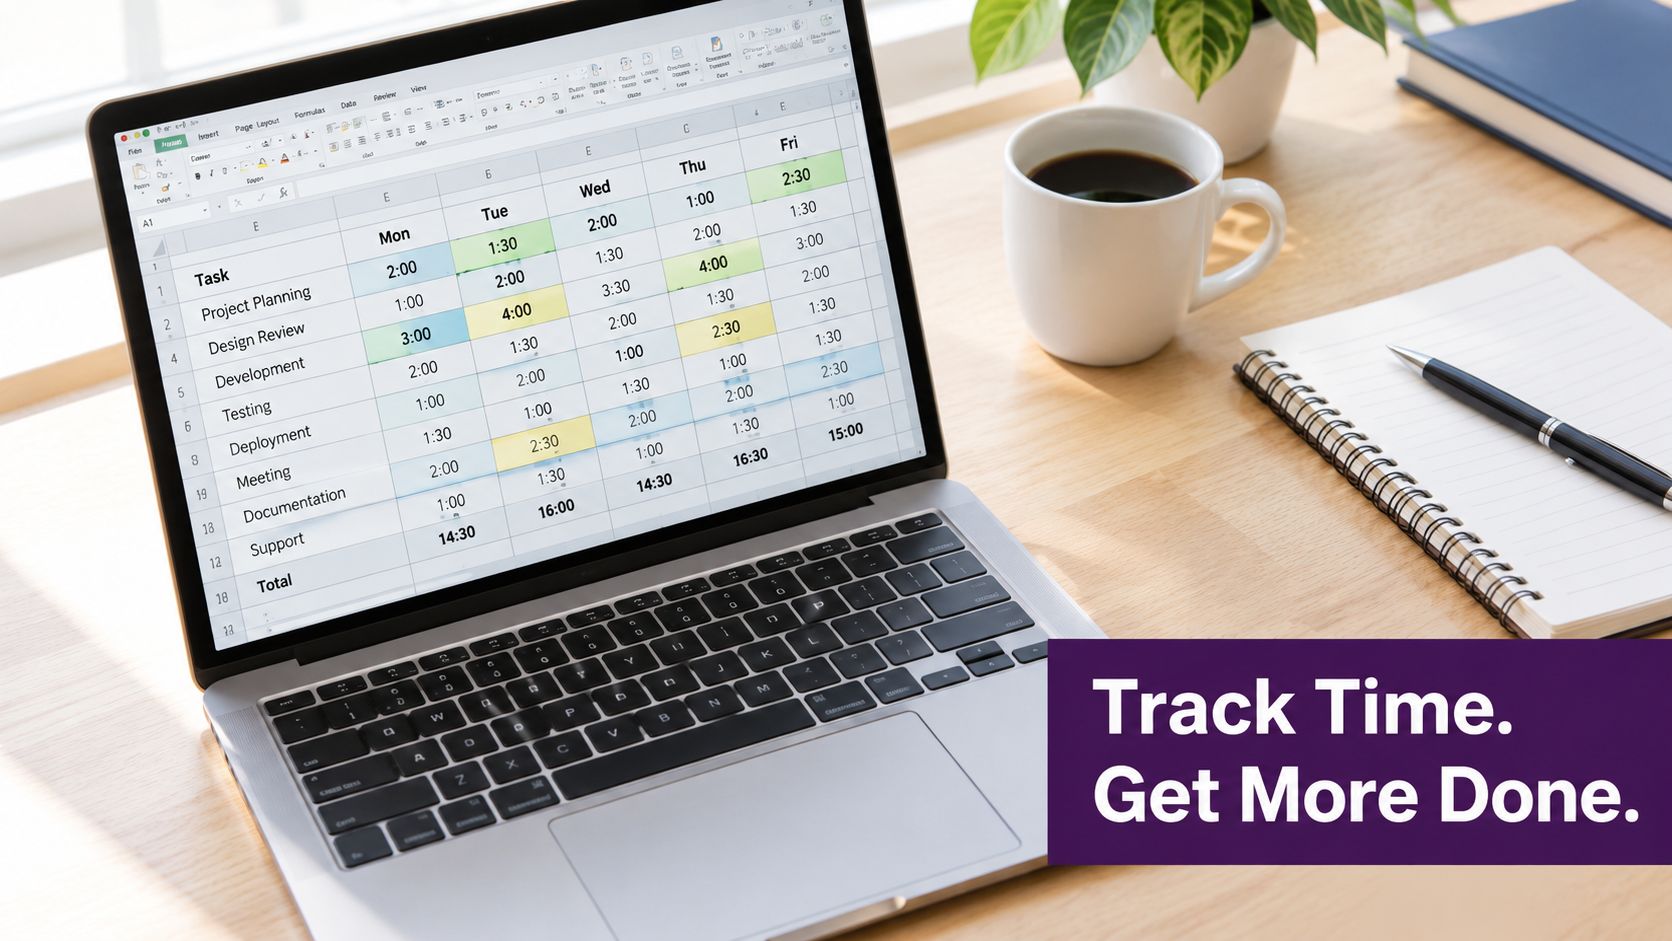
Use a simple layout with scheduled paid time in column A and shrinkage categories in columns or rows. One adaptable template looks like this:
| Cell | Label | Entry or formula |
|---|---|---|
| A2 | Total paid minutes | Enter scheduled paid minutes |
| B2 | Training minutes | Enter recorded minutes |
| B3 | PTO and holiday minutes | Enter recorded minutes |
| B4 | Meeting minutes | Enter recorded minutes |
| B5 | Break and lunch minutes | Enter recorded minutes |
| B6 | Sickness and other minutes | Enter recorded minutes |
| B7 | Total shrinkage minutes | =SUM(B2:B6) |
| C2 | Shrinkage rate | =SUM(B2:B6)/A2 |
| C3 | Shrinkage factor | =1/(1-C2) |
The requested rate formula is =SUM(B2:B6)/A2. Format that cell as a percentage. The factor formula is =1/(1-rate) when rate is a named range, or =1/(1-C2) when the rate sits in cell C2.
The labels matter. If a planner mixes calendar minutes with scheduled paid minutes, the denominator becomes misleading. Use the same time basis throughout, and decide whether the sheet is measuring actual results, a forecast assumption, or both.
Connect the factor to staffing
Keep the staffing model on a second sheet. Store the net productive requirement in one cell, then reference the factor rather than typing it again:
Gross scheduled requirement = Net productive requirement × Shrinkage factor
You can use a named range such as ShrinkageFactor, or retrieve a factor from a category table with VLOOKUP. A named range is often easier for a small operation because a single change refreshes every downstream calculation.
Watch for three spreadsheet errors:
- Forgetting FTE: Convert the gross hours into the correct number of full-time equivalents for the schedule being modeled.
- Mixing time bases: Don’t compare calendar availability with paid scheduled minutes.
- Hard-coding assumptions: Reference the rate cell so the factor changes automatically when actual shrinkage changes.
For teams that need a consistent view across schedules and reporting periods, connect the workbook to CallZent’s reporting and metrics dashboards. The tool is less important than the control: every staffing result should trace back to an identifiable input.
Applying the Factor to Staffing and Forecasting
The gross-up formula is simple:
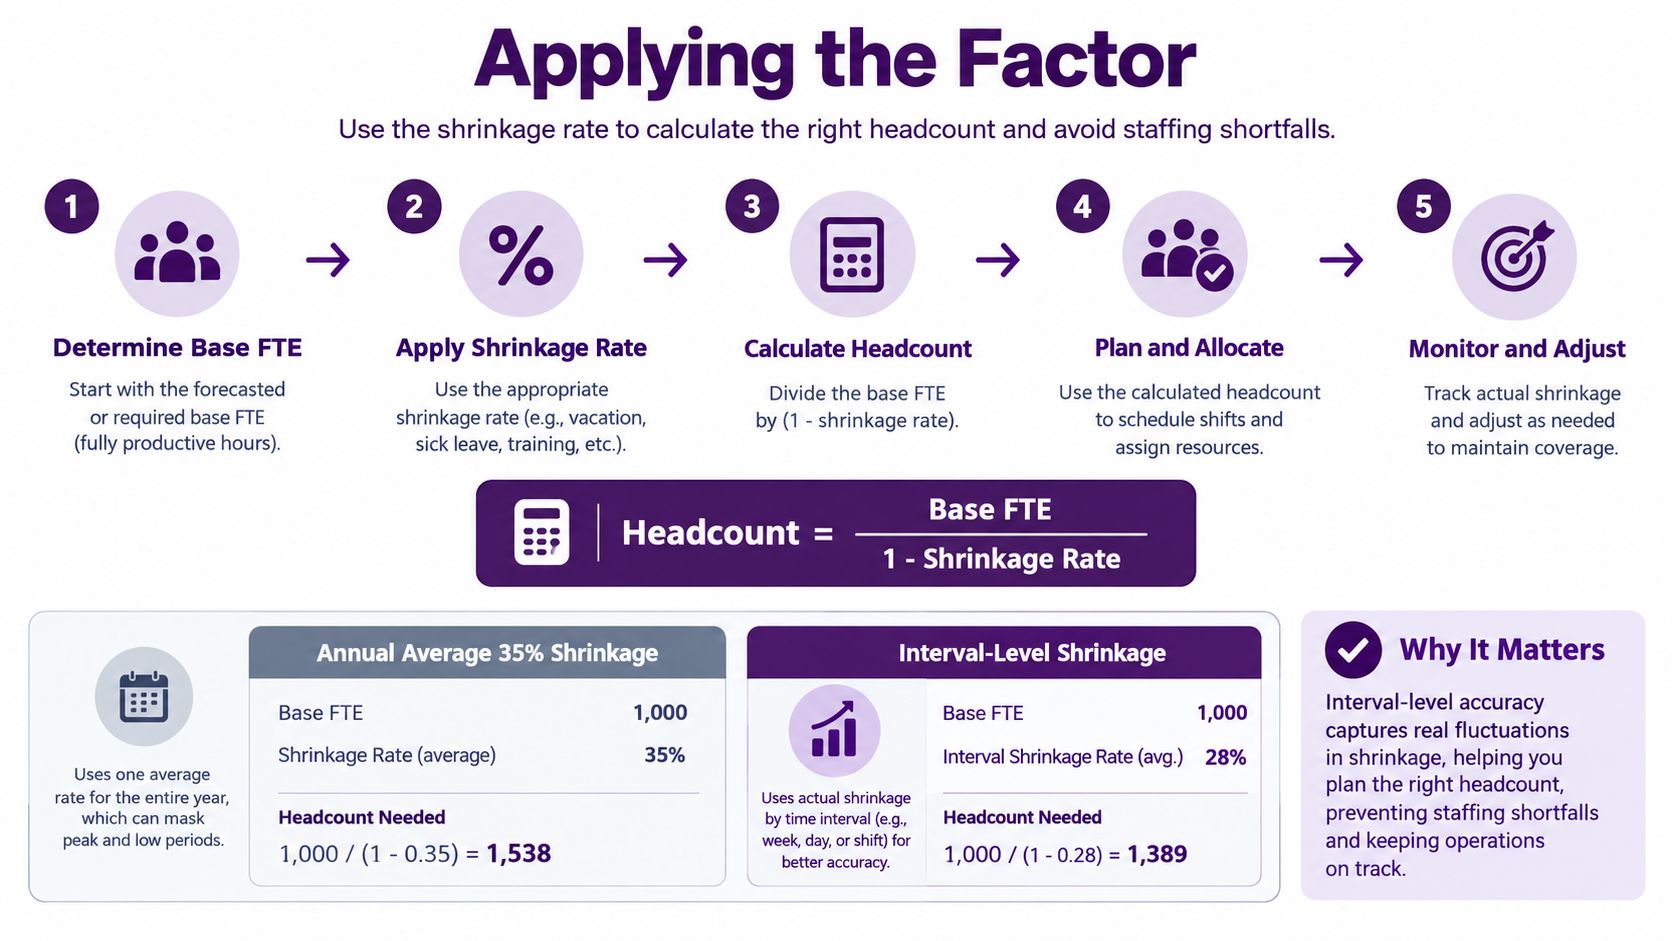
Headcount = Base FTE ÷ (1 − Shrinkage Rate)
The difficult part is choosing the right rate for the right period. An annual average can hide a shortage in a particular interval. A Saturday morning may carry more absence, training, or leave than a normal weekday, while the annual number smooths that difference away.
Match the factor to the operating pattern
Consider three planning situations:
Steady weekday load. If shrinkage categories are distributed consistently across ordinary weekday intervals, a stable factor may provide a reasonable starting point. The planner still needs to validate actual adherence and break timing against the schedule.
Seasonal spike. During a period of unusually high demand, training or PTO may remove capacity at exactly the time the queue needs it most. The planner should protect the peak intervals rather than relying on a quiet-period average.
Weekend coverage. A smaller weekend roster can be more sensitive to one absence or a concentrated break pattern. A factor derived from weekday behavior may understate the paid capacity required for weekend coverage.
The contact-center benchmark guidance on shrinkage explains why gross-up math becomes more consequential as shrinkage rises. At 30% shrinkage, staffing must increase by about 43% over the net requirement, because the productive share is 70%, not 100%.
Avoid double-counting
Shrinkage belongs in the capacity bridge, but it shouldn’t be added again through another assumption. Before publishing the roster, check:
- Forecast demand: Does volume and AHT produce a net productive requirement?
- Occupancy: Is the planned occupancy assumption already removing some non-contact time?
- Shrinkage: Are breaks, leave, training, meetings, and absence included once?
- Adherence: Is actual schedule compliance monitored separately from the forecast assumption?
- Skills and intervals: Can the scheduled people handle the required contact types at the required times?
A planner may also need flexible staffing solutions when shrinkage concentrates around predictable events. Flexibility can include reserve capacity, cross-skilled agents, adjusted training windows, or carefully planned overtime. It shouldn’t replace accurate measurement.
For a broader operating framework, CallZent’s contact-center workforce management resource can help connect forecasting, scheduling, adherence, and shrinkage in one process. The factor is a planning input, not a guarantee of service level. The roster still has to place the right skills in the right intervals.
Industry Benchmarks and Healthy Ranges
Benchmarks can tell you whether a result deserves investigation, but they shouldn’t become a target to minimize. A low shrinkage number may mean the operation is efficient. It may also mean PTO, internal activities, or absence aren’t being recorded.
Industry guidance places typical contact-center shrinkage in a broad range. Some materials cite 20% to 35% for workforce planning, while other guidance describes a broader 25% to 38% range across contact-center contexts. Inbound operations are also commonly associated with a 30% to 35% range. These figures should be treated as reference points, not universal standards.
| Channel or sector view | Reference range | Warning sign |
|---|---|---|
| General contact-center planning | 20% to 35% | The number has no category breakdown |
| Inbound contact-center guidance | 30% to 35% | A voice operation reports a very tight figure without evidence |
| Broader contact-center contexts | 25% to 38% | One annual average is used for every interval |
| High-leave or high-compliance operations | Often toward the upper part of the range | Training, leave, or compliance time is omitted |
A result below 20% for a voice team shouldn’t be rejected automatically. Ask what it includes. Does the denominator contain paid time or scheduled time? Are internal meetings, coaching, system downtime, and unscheduled sickness visible? Are managers counting only planned absence while finance is expecting all paid non-productive time?
Small operations can also show different patterns from large BPO sites. A smaller team may rely on cross-training and carry more administrative work per person. A larger site may distribute those activities across dedicated functions. The correct benchmark is the one that reflects the operation’s actual work design.
Healthy means explainable. A planner should be able to reconcile the percentage to records, categories, and intervals. The lowest number isn’t automatically the most accurate number.
Tips to Measure and Reduce Shrinkage
Run shrinkage as a weekly operating review, not as a once-a-year assumption. The WFM system should capture every paid absence category, and supervisors should use the same reason codes across teams. Reconcile the published schedule with actual activity for each shift, then review the result by interval, team, and skill.
Build a dependable measurement routine
Use this sequence:
- Capture consistently: Record training, PTO, meetings, breaks, sickness, technical downtime, and other paid non-productive time in one system.
- Tag reasons clearly: Don’t let every supervisor create a different label for the same absence type.
- Reconcile schedule to actuals: Compare what the schedule promised with what agents did.
- Segment the result: Review daypart, queue, site, skill, and team rather than relying only on a monthly average.
- Recalculate the factor: Update the multiplier when the measured rate changes materially or when the operating pattern changes.
The contact-center employee retention resource is useful context for separating avoidable attendance problems from legitimate activities that support agent capability and retention. Reduction doesn’t mean removing every non-contact activity. It means controlling avoidable loss while protecting necessary work.
Reduce the causes you can influence
Scheduling hygiene starts with adherence monitoring, break compliance, and clear PTO planning windows. The owner is usually the operations supervisor or WFM planner. Measure scheduled versus actual start times, breaks, and returns, then look for a sustained improvement in the shrinkage rate rather than isolated good days.
Forecasting accuracy reduces emergency schedule changes. WFM owns interval load curves and intraday reforecasts, while operations confirms whether the forecast reflects campaign, queue, and skill changes. Improvement appears as fewer last-minute staffing changes and a closer match between planned and actual shrinkage.
Engagement practices include coaching on adherence and a consistent attendance process. Team leaders own the conversations, and HR or operations owns the policy. Measure attendance patterns and adherence by team, not just the center total.
The work environment affects avoidable absence. Return-to-work interviews can identify recurring issues, while ergonomics reviews may reveal problems that contribute to sickness. HR, facilities, and operations should agree on ownership and document what changes follow each review.
Policy review covers holiday allocation, comp-time rules, training capacity, and voluntary time off. Finance, HR, WFM, and operations need one shared view of the paid-time denominator.
FAQ for planners
Which categories belong in shrinkage?
Include paid time when agents aren’t available for contacts, including both external items such as leave and sickness and internal items such as meetings, coaching, training, and downtime.
Does training count?
Yes. Training is productive for capability development, but it’s non-productive for live contact capacity during the training period.
How should exceptional absences fit?
Treat them according to the same measurement principle as any other absence. Record the paid time, use a consistent reason code, and keep exceptional periods visible rather than blending them discreetly into a normal average.
How often should the factor be recomputed?
Recompute it whenever the measured shrinkage pattern changes, the schedule design changes, or a major operational event alters availability. Weekly review supports control, while the planning horizon may require a longer stabilized assumption.
CallZent Workforce Management
Turn Shrinkage Data Into a Practical Staffing Plan
CallZent provides bilingual nearshore call center and BPO support from Mexico, including workforce management, customer service, technical support, back-office operations, and flexible staffing capacity.
Discuss Your Staffing Model