

Call Center Performance & Quality
Call Center Agent Metrics: 8 KPI Groups to Track in 2026
Read resolution, speed, customer feedback, quality, and staffing measures together to make better operating decisions.
TL;DR — Quick Takeaways
- Pair speed with verified resolution so short calls do not hide unfinished work.
- Distinguish agent-controlled behavior from queue, policy, system, and staffing constraints.
- Define denominators, cohorts, observation windows, and exceptions before comparing results.
- Read CSAT with QA and outcomes; use NPS in the wider customer relationship view.
- Assign an owner and next review date to each corrective action; act on urgent issues immediately.
Your dashboard looks green, but customers are still calling back. You’re in a monthly review. Handle time is down, agents are answering quickly, and the scorecard shows everyone on target. Yet customers keep contacting you about unresolved refunds, account access, and billing corrections. Some stop calling because they’ve switched providers.
The problem isn’t necessarily agent effort. It’s how you read call center agent metrics. A short call can mean an efficient resolution or a rushed goodbye. A satisfied customer can still need another contact because the promised account correction never happened.
You need measures that expose those differences. Whether you’re managing an internal team or buying bilingual nearshore support, connect each number to its trade-off and a specific operating decision. For automated intake and triage, ask the same question: did customers reach the right help, or did you simply move them through intake faster?
1. First Call Resolution (FCR)
First Call Resolution measures whether the customer’s issue was fully resolved during the initial contact, without another contact for the same issue within a defined observation window. Document whether a transfer completed within that first contact qualifies; a necessary escalation should not be treated as poor handling. For digital channels, use the broader term first contact resolution and define what counts as an interaction.
Calculate FCR as eligible issues resolved during their first contact divided by all eligible issues in the same cohort, multiplied by 100. Give each issue enough follow-up time to detect repeat contacts. Set targets by issue type, complexity, and agent authority rather than applying a universal benchmark.
The trade-off is immediate closure versus verified resolution. An agent selecting a resolved disposition doesn’t prove that a refund arrived or that a technical fix worked.

Validate the outcome before rewarding the score
Say an e-commerce team requires supervisor approval for routine refunds. Giving agents clear refund authority could remove avoidable escalations, but the team must still check whether customers contact support again about payment status.
Match contacts by customer, issue, and order or case identifier. Use a documented observation window that fits the process, and distinguish a new problem from an unresolved previous one.
Your BPO reporting pack should include:
- Verified repeat contacts: Identify reopened issues across phone, email, and chat.
- Resolution barriers: Separate agent knowledge gaps from approval restrictions and back-office delays.
- Matched comparisons: Break results down by language, issue type, and complexity.
FCR works when it measures a solved problem, not a closed ticket. Improve it through searchable knowledge, clear decision rights, and callback-reason reviews. Don’t punish an appropriate escalation just to protect the percentage.
2. Average Handle Time (AHT)
A healthcare benefits call runs long because the agent searches separate eligibility, policy, and claims screens. Coaching that agent to speak faster won’t fix the underlying problem. A unified lookup workflow might.
Average Handle Time includes talk time, hold time, and after-call work, divided by handled calls. For voice calls, write the formula as (total talk time + total hold time + total after-call work) ÷ handled calls. Amazon Connect’s metric definitions illustrate how a platform defines handle time and other operational measures. Reconcile your reporting rules with the system you actually use.
Use AHT to plan capacity and locate friction. Don’t treat every long interaction as poor performance or every short interaction as success.
Practical rule: AHT is a capacity metric, not a performance grade. Reduce wasted effort before reducing customer conversation.
Separate necessary work from avoidable delay
Break AHT into its components. Long hold time may indicate slow approvals. Long after-call work may reflect duplicate documentation. Long talk time may be necessary for complex troubleshooting or a customer who needs a careful explanation.
Pair AHT with FCR, CSAT, and documentation accuracy. If handle time falls while repeat contacts rise, the apparent efficiency gain needs investigation.
For your reporting pack, include:
- Call-category targets: Compare billing disputes with billing disputes, not password resets.
- Component trends: Show talk, hold, and wrap-up separately.
- Exception explanations: Flag system outages, training periods, and policy changes.
Our guide to average handle time explains the metric in greater detail. For operational decisions, focus on cost per successfully resolved issue, not merely cost per call. A faster interaction isn’t cheaper if the customer must start over.
3. Customer Satisfaction Score (CSAT)
A financial-services customer gets their account opened but leaves frustrated. The agent followed the security process correctly, yet never explained why the questions were necessary. Resolution succeeded; communication didn’t.
CSAT measures how satisfied customers feel about a particular interaction. Calculate it as satisfied survey responses divided by all valid responses, expressed as a percentage. Define the satisfied response categories before reporting results, and keep them consistent.
The trade-off is customer sentiment versus confirmed completion. A warm conversation can earn positive feedback before a promised correction fails. A necessary policy decision can produce negative feedback even when the agent handled it properly.

Read the comments behind the percentage
Keep the survey short and send it consistently. Don’t let agents choose which customers receive it, and don’t assume respondents represent everyone who contacted you.
For bilingual programs, check that survey wording carries the same meaning in English and Spanish. Segment results by language without treating language alone as an explanation for performance differences.
- Pair with resolution: Identify satisfied customers whose issues later reopen.
- Show response coverage: Include invitation volume, completed surveys, and missing feedback.
- Classify comments: Separate agent behavior from product, price, policy, and fulfillment complaints.
CSAT tells you how the customer felt, not everything that happened. There’s no useful universal target without a stable survey method and comparable contact mix. Improve the score through clearer explanations, realistic commitments, and ownership of next steps, not requests for favorable ratings.
4. Net Promoter Score (NPS)
NPS belongs in your reporting pack, but not as a standalone agent grade. It measures the customer’s willingness to recommend the company, which includes far more than the latest support conversation.
The method described in Bain’s Net Promoter Score guidance uses a scale from 0 to 10. Respondents scoring 9 or 10 are promoters, 7 or 8 are passives, and 0 through 6 are detractors. Calculate NPS by subtracting the percentage of detractors from the percentage of promoters.
That distinction matters for accountability. An excellent agent can’t reverse a prolonged service outage, an unpopular price increase, or a defective product during a single conversation.
NPS measures the relationship. Agent-level metrics help explain the service contribution to that relationship.
Separate recovery work from agent coaching
Consider a subscription business surveying customers after onboarding. Detractor comments may reveal unclear setup instructions, missing features, or an agent who ended the call without confirming the customer could use the service.
Those problems need different owners. Send product limitations to the product team, repair onboarding materials, and coach the agent on confirmation and next steps.
Your reporting pack should show:
- Journey context: Identify whether feedback followed onboarding, renewal, or complaint handling.
- Reason categories: Separate service behavior from broader commercial issues.
- Recovery ownership: Assign a named owner and track whether the customer’s concern was addressed.
Judge improvement against a consistent customer cohort and survey timing. Review longer-term trends rather than reacting to a small batch of responses.
Use NPS with CSAT and QA, not instead of them. Loyalty feedback helps prioritize business changes; interaction evidence tells you which behaviors an agent can improve.
5. Average Speed of Answer (ASA) and Service Level
ASA and service level answer different questions. ASA shows the average queue wait before answered calls connect. Service level shows how many offered calls were answered within your agreed threshold.
Calculate ASA as total queue waiting time for answered calls divided by answered calls. For an answer-within-threshold service-level measure, divide eligible calls answered within the threshold by eligible offered calls, then multiply by 100. Document any short-abandon exclusions, transfers, callbacks, and time boundaries. Platform measures with similar names may count different events.
An 80/20 service level means an agreed goal of answering 80% of eligible offered calls within 20 seconds under documented calculation rules. This is an illustrative service commitment, not a universal target for every queue.
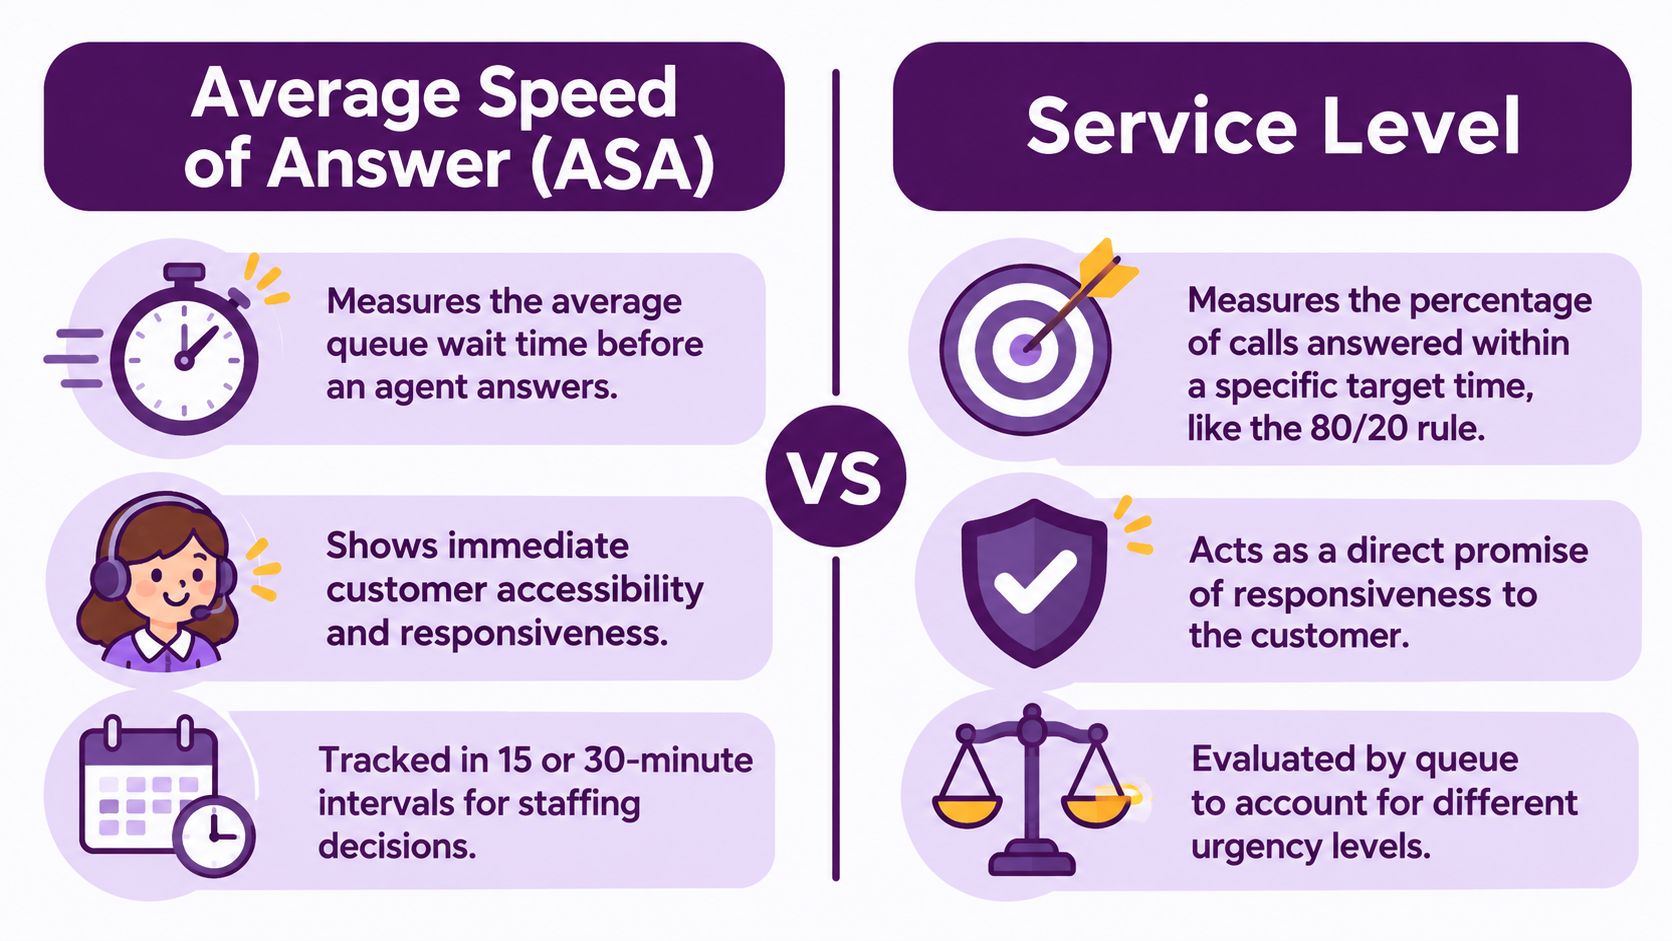
Pair access speed with coverage and abandonment
Say a healthcare scheduling line struggles at the beginning of the week. A daily average can conceal the busiest arrival period. Compare demand, staffing, adherence, and wait times within scheduling intervals before changing headcount.
The trade-off is fast access versus staffing cost and sustainable workload. Don’t solve waiting by stripping out breaks or rushing active calls.
Your reporting pack needs queue-level service results, offered volume, abandonment, and staffing variances. Document whether the service-level calculation excludes any short abandons so the denominator doesn’t change unnoticed.
Service level is the promise; ASA describes average answered-call waiting. Neither proves that every caller received timely help. Review both with abandonment before declaring accessibility healthy.
6. Abandonment Rate
Abandonment rate measures callers who disconnect before reaching an agent. For queue abandonment, calculate caller disconnects while waiting for an agent ÷ calls entering that queue × 100. Report exits in the IVR or before queue entry separately against the relevant entry population, rather than mixing different stages in one denominator.
The trade-off is apparent queue efficiency versus customers who never receive help. Answered calls might look fast because callers unwilling to wait have already left. Don’t evaluate accessibility using only the customers who stayed.
A retail caller who hangs up during a confusing menu needs a different fix from someone who leaves after a lengthy queue wait. Break the journey into entry, menu navigation, queue entry, and connection.
Find where callers leave
Say customers calling about delivery status must listen to unrelated menu options before choosing support. Simplifying the menu and offering a clear order-status route addresses navigation friction. Adding staff without changing that menu may leave the early abandonment problem untouched.
For late abandons, compare arrival patterns with staffed capacity. Offer callbacks when appropriate, but measure whether the promised callbacks happen.
- Separate early and late exits: Diagnose navigation problems separately from waiting.
- Disclose exclusions: Show the full inbound denominator alongside any adjusted view.
- Track callback completion: Don’t count a callback request as a completed customer outcome.
There isn’t a useful universal target without knowing your queue, urgency, and calculation rules. Improve against a consistent baseline while checking that abandoned callers aren’t repeatedly trying again.
Our guide to reducing call abandonment covers practical interventions. The reporting decision is simple: identify whether customers need clearer routing, more capacity, or a reliable alternative to holding. Don’t label every abandoned call an agent failure.
7. Schedule Adherence
Your forecast assumes agents will be available at particular times. If breaks, coaching, and login times drift, the planned coverage won’t match the floor.
Schedule adherence measures time spent in the scheduled activity divided by total scheduled time, expressed as a percentage. Scheduled training and breaks count as correct activity when taken as planned. Adherence isn’t the same as time spent handling calls.
Define the scheduled states, matching rules, and approved exceptions before setting an adherence target. A benchmark from another operation is not a substitute for your own workload, schedules, and activity-code definitions.
Protect coverage without creating rigid behavior
The trade-off is schedule discipline versus necessary flexibility. An agent shouldn’t disconnect a difficult customer because lunch has started. A supervisor should record the exception and adjust coverage rather than misclassify the interaction as misconduct.
Say an e-commerce promotion creates longer calls and delayed breaks. Compare actual demand with the forecast, stagger breaks where feasible, and correct the plan before coaching everyone on punctuality.
Your reporting pack should distinguish:
- Agent-controlled deviations: Unexplained late logins or activity changes.
- Approved exceptions: Extended calls, coaching, and supervisor-directed work.
- System barriers: Login failures, outages, or incorrect schedule loading.
Our workforce management guide explains how scheduling connects with service delivery. Review adherence alongside service level and occupancy so agents aren’t rewarded for following a schedule that no longer fits demand.
Good adherence supports a workable staffing plan. It cannot rescue a bad one. Coach avoidable deviations, but give supervisors responsibility for keeping schedules realistic.
8. Quality Assurance (QA) Score
QA measures whether interactions meet your standards for accuracy, communication, compliance, and process. Review calls, chats, or emails against a defined scorecard, then calculate earned weighted points as a share of applicable points.
Keep critical errors visible outside the overall average. A pleasant greeting and polished closing shouldn’t offset a missed verification step or an incorrect benefits explanation.
The trade-off is interaction volume versus reliable execution. A team can handle more contacts while making errors that create rework, customer harm, and compliance exposure.
Coaching principle: A QA score is useful only when someone can name the behavior to repeat or change.
Make scoring consistent and actionable
Consider a healthcare support team whose reviewers disagree about what counts as complete verification. Have them score the same interaction independently, compare evidence, and agree on an interpretation before evaluating more agents.
Then give the agent specific feedback: identify the missed step, demonstrate the correct behavior, and review a later interaction for follow-through. Our customer-service QA guide explains how quality review supports that process.
Include scorecard version, sampling method, critical defects, reviewer disagreements, and coaching follow-up in the reporting pack. Apply documented privacy, recording, and access controls to monitoring and coaching materials.
If AI generates summaries or evaluations, validate its results against qualified human review. Check missed defects, false flags, language differences, and changes after model or policy updates. Use the output to support review rather than treating an automated score as proof.
Pair QA with FCR and CSAT. That combination helps distinguish correct procedures, completed outcomes, and the customer’s experience.
How the 8 Call Center Agent Metrics Compare at a Glance
| Item | Core Formula | Target or Interpretation | Best For |
|---|---|---|---|
| First Call Resolution (FCR) | Eligible issues resolved on first contact ÷ all eligible issues in the same cohort × 100 | Set by issue mix, authority, and verification method | Tracking first-contact problem solving and repeat contacts |
| Average Handle Time (AHT) | (Total talk time + total hold time + total after-call work) ÷ handled calls | Varies by call type; balance with quality metrics | Capacity planning and identifying workflow inefficiencies |
| Customer Satisfaction Score (CSAT) | Satisfied responses ÷ total responses × 100 | No universal target; varies by organization | Measuring immediate customer satisfaction |
| Net Promoter Score (NPS) | Percentage of promoters − percentage of detractors | No universal target; varies by industry | Tracking customer loyalty and long-term relationship health |
| Average Speed of Answer (ASA) and Service Level | ASA: total answered-call queue wait ÷ answered calls; answer service level: eligible calls answered within threshold ÷ eligible offered calls × 100 | Common service-level example: 80% answered within 20 seconds | Assessing accessibility and informing staffing |
| Abandonment Rate | Queue abandons ÷ calls entering that queue × 100 | Set a queue-specific goal; disclose exclusions | Identifying queue, routing, and staffing problems |
| Schedule Adherence | Time in the correct scheduled state ÷ total scheduled time × 100 | Set using scheduled states and exception rules | Monitoring schedule compliance and staffing coverage |
| Quality Assurance (QA) Score | Earned weighted points ÷ applicable weighted points × 100 | Set according to scorecard and compliance requirements | Coaching agents and monitoring service consistency and compliance |
These are eight reporting groups: ASA and service level are distinct measures grouped together. Queue access, staffing, and relationship outcomes should not be attributed to individual agents without examining what they can control.
Track Fewer Metrics Together and Review Them Every Month
These call center agent metrics are useful only when you read them together. Pair speed with resolution, service level with adherence, and CSAT with QA. Keep NPS in the relationship view rather than using it to assign responsibility for everything the customer dislikes about the business.
Start with the measures that match your biggest problem. For repeat billing calls, prioritize verified FCR, handle-time components, and quality defects. For missed appointment requests, focus on service level, abandonment, and schedule coverage.
Make the monthly reporting pack decision-ready
A reporting pack should help you choose an action, not just confirm that someone exported a dashboard. Keep definitions and denominators visible so a change in calculation can’t masquerade as better performance.
- Show comparable groups: Separate language, issue type, channel, complexity, and agent tenure.
- Explain exceptions: Identify outages, policy changes, unusual demand, and staffing gaps.
- Assign corrective work: Record the owner, intended outcome, and next review point.
- Check for trade-offs: Confirm that improvements didn’t increase repeat contacts, defects, or customer effort.
Review operational queues throughout service delivery, then use the monthly meeting to assess trends and corrective actions. Don’t wait for the monthly review to address an inaccessible queue or a critical quality defect.
Workload sustainability needs attention too. Review occupancy with demand variability, call complexity, breaks, absence, and available capacity. High occupancy can indicate sustained pressure, but there is no single safe threshold for every operation. Occupancy is a staffing diagnostic, not a reason to penalize agents for low demand.
Agree on what happens when metrics conflict
Set decision rules before performance pressure rises. If AHT improves but verified resolution worsens, investigate premature closure and missing work. If adherence improves but service level doesn’t, revisit the staffing assumptions rather than demanding more discipline.
For a nearshore program, we evaluate skills, channels, schedules, technology, and performance expectations before designing the team. Our agents train around your tools, scripts, policies, service standards, and goals, so comparisons need to reflect those working conditions.
CallZent provides supervision, QA monitoring, coaching, and performance reporting. The useful output is a clear connection between the customer problem, the operating cause, and the next action.
A better scorecard doesn’t make every number green. It makes the next decision clearer. Keep the measures that expose unresolved work, protect service quality, and show where management needs to remove obstacles.
Frequently Asked Questions
Which call center agent metrics should a business track?
Start with FCR, AHT, CSAT, and QA for interaction outcomes and execution. Add ASA, service level, abandonment, and schedule adherence to assess access and staffing. Use NPS for relationship feedback. Interpret each measure according to who can influence it.
How do you calculate first call resolution?
Divide eligible issues resolved on their first contact by all eligible issues in the same cohort, then multiply by 100. Define the observation window, exclusions, transfers, and repeat-contact matching. Avoid counting an agent’s resolved disposition as verified resolution without outcome evidence.
What is the average handle time formula?
For voice calls, AHT equals total talk time plus total hold time plus total after-call work, divided by handled calls. Keep units and reporting boundaries consistent. Compare similar call types and review component times alongside resolution, quality, and customer feedback.
What is the difference between ASA and service level?
ASA is the average queue wait for answered calls. An answer-within-threshold service level is the percentage of eligible offered calls answered within a defined time. Document the denominator and exclusions because platform definitions differ. Review both with abandonment and interval demand.
Is an 80/20 service level required for every call center?
No. Answering 80% of eligible calls within 20 seconds is an illustrative service commitment, not a universal requirement. Choose a target based on customer urgency, call patterns, available capacity, costs, and the consequences of delayed access.
How should a call center calculate abandonment rate?
For queue abandonment, divide callers who disconnect while waiting for an agent by calls entering that queue, then multiply by 100. Report pre-queue and IVR exits separately. Disclose short-abandon exclusions and distinguish callback requests from completed callbacks.
Should NPS be used to grade individual agents?
NPS should not be a standalone agent grade because product, pricing, outages, and the broader relationship influence it. Use comments to identify owners for recovery work. Pair relationship feedback with interaction-level QA, CSAT, and resolution evidence before coaching an agent.
Does schedule adherence mean agents should stay on calls all day?
No. Adherence compares actual activity with scheduled activity, including planned breaks, training, and coaching. It is different from occupancy and handling time. Record approved exceptions and system issues, and never encourage agents to disconnect customers merely to match a schedule.
How can bilingual teams compare agent metrics fairly?
Use equivalent English-Spanish survey wording, qualified reviewers, and consistent definitions. Segment by language, issue type, complexity, channel, tenure, and authority. Examine sample coverage and workflow differences before attributing an outcome gap to language or individual agent performance.
What belongs in a BPO performance reporting pack?
Include definitions, denominators, cohort or time boundaries, volumes, comparable segments, survey coverage, QA sampling, critical defects, and approved exceptions. Record corrective actions, owners, and review dates. Monitor urgent queue or security issues during operations rather than waiting for a monthly meeting.
Bilingual Nearshore Support in Mexico
Build a Support Scorecard That Leads to Action
Discuss your contact volume, workflows, English-Spanish coverage, and service goals with CallZent. Define a team and reporting approach built around quality, resolution, and clear ownership.