

Call Center KPIs
Call Center KPIs Your Business Needs to Track
Learn which call center KPIs matter most, how to balance FCR, CSAT, AHT, and service level, and how nearshore teams should build practical KPI dashboards.
TL;DR — Quick Takeaways
- Track the metrics that change action. A useful KPI tells supervisors what to coach, tells operations what to fix, and tells executives whether the center is supporting retention, revenue, or cost control.
- Use a small core set tied to outcomes. For most voice programs, that means FCR, CSAT, service level, AHT, and agent adherence.
- Balance speed with quality. Lower handle time can help labor efficiency, but it can also hurt resolution and customer sentiment if agents start rushing.
- Match the review cadence to the metric. Service level may need daily attention. CSAT trends and coaching signals usually make more sense in weekly or monthly review.
- Add context for nearshore and bilingual teams. Longer calls are not always a problem if they reflect better resolution, clearer communication, or fewer repeat contacts.
Most call centers don’t have a measurement problem. They have a focus problem.
If your team is tracking everything from call volume to wrap-up time to occupancy to survey scores, but leaders still can’t answer whether service is getting better or worse, your dashboard is probably full of noise. The central question is simple. Are your call center KPIs helping you make better decisions, or are they just filling reports?
Are You Tracking the Right Call Center KPIs
Are your KPIs helping your managers make better calls, or are they just filling another dashboard?
In our experience, managers often inherit scorecards built around whatever the phone system, QA tool, CRM, and WFM platform happen to measure. That creates a reporting habit, not a management system. A KPI only earns its place if it changes a decision, a coaching action, or a staffing move.
In a nearshore operation, that standard gets stricter. Bilingual teams deal with language switching, wider call-type variation, and client expectations tied to both cost and customer experience. If leaders treat every metric as equally important, supervisors spend their time reacting to noise while service problems keep repeating.
The best KPI dashboard isn’t the one with the most data. It’s the one that makes the next decision obvious.
This is especially true in outsourced and nearshore environments. If the client cares about cost per contact, the ops team cares about occupancy, and QA cares about compliance, someone has to decide which measures lead and which ones explain the result. Without that discipline, teams argue about symptoms. They miss the trade-offs that drive performance. For a practical example of how strong operators structure that work, see how high-performing teams monitor call center performance.
Choosing Your Core 5 Call Center KPIs
Which five numbers would you keep if the client cut your dashboard down tomorrow?
That question gets to the actual job of KPI selection. A common mistake is to build dashboards backward from whatever the phone system, QA tool, WFM platform, or CRM already measures. Then supervisors inherit a long report, but no clear priority. In a nearshore operation, that usually leads to the wrong conversation. Teams spend time defending handle time, while repeat contacts, schedule discipline, or bilingual routing issues keep hurting the business.
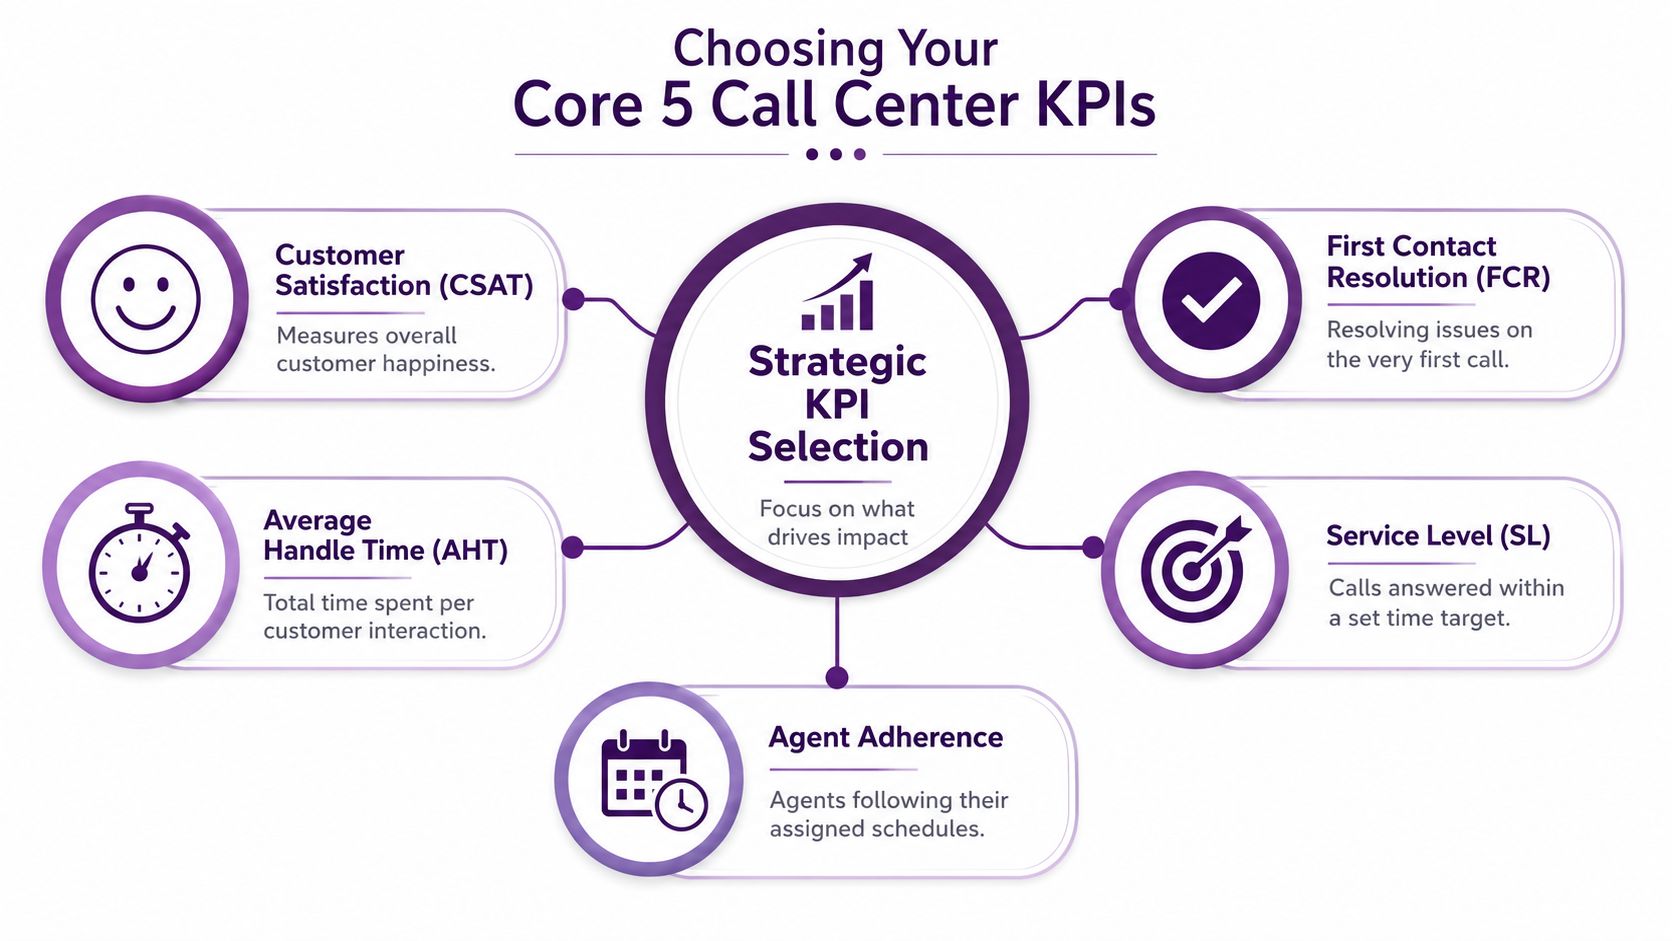
Pick the metrics that answer management questions
A workable core set answers five operating questions fast:
- Are customers getting their issue resolved? FCR and CSAT answer that from different angles.
- Can customers reach us without friction? Service level shows whether access is holding.
- Are agents working efficiently without cutting corners? AHT helps, but only with resolution and quality beside it.
- Is the staffing plan being followed? Adherence shows whether coverage problems start in forecasting or on the floor.
- Can managers identify the cause, not just the symptom? The set has to combine customer outcome metrics with operational control metrics.
This matters more in bilingual programs. A longer call in Spanish support is not automatically a problem if it produces better resolution and fewer callbacks. I would rather defend a slightly higher AHT than explain why a low-cost operation created more volume, more escalations, and lower retention.
A practical filter for choosing the five
To choose your core call center KPIs, use this filter:
- Tie each KPI to a business outcome. Retention programs need customer outcome measures near the top. Cost-focused programs need stronger visibility into efficiency and staffing execution.
- Include one metric for customer outcome, one for access, one for efficiency, and one for workforce control. The fifth slot usually goes to the client’s biggest risk, such as compliance, sales conversion, or QA.
- Drop any metric that does not trigger action. If no one changes coaching, routing, staffing, or process design because of it, it does not belong in the core five.
- Avoid overlap. If two metrics tell nearly the same story, keep the one leaders can use faster in a weekly review.
- Test the trade-off. If improving one metric would predictably damage another, both deserve a place on the dashboard.
That last point is where many KPI sets fail.
A retail support team can hit service level by overstaffing. It can cut AHT by rushing calls. It can improve adherence by forcing schedules that increase attrition. None of those are real wins. The right KPI mix makes those trade-offs visible before they become expensive.
For most voice programs, the core five are still FCR, CSAT, service level, AHT, and adherence. The reason is not tradition. It is coverage. Together they show whether the center is easy to reach, resolves issues well, runs efficiently, and executes the staffing plan. If one number moves, the other four help explain whether that change reflects improvement or a hidden cost.
If you need a clearer way to set targets around those five, use these performance targets for customer service teams as a starting point.
The Essential Call Center KPIs Explained
Which KPI changes performance, and which one just fills a dashboard?
In a nearshore call center, that question matters. A bilingual team can post a good service level and still miss revenue, create repeat contacts, or frustrate customers who had to explain the same issue twice, first in one language and then again in another. The useful KPIs are the ones that expose those trade-offs early.
Core call center KPIs at a glance
| KPI | Formula | What good operators look for |
|---|---|---|
| First Call Resolution (FCR) | Resolved on first contact / total resolved cases | Stable resolution on issues that should close in one interaction, especially high-volume transactional contacts |
| Customer Satisfaction (CSAT) | Positive satisfaction responses / total responses | Satisfaction by call type, team, and language, not just one blended score |
| Service Level (SL) | Calls answered within target threshold / total offered calls | Fast enough access without overstaffing the queue |
| Average Handle Time (AHT) | Talk time + hold time + after-call work, divided by total calls | Efficient calls without cutting corners on empathy, compliance, or resolution |
| Agent Adherence | Time agents follow assigned schedules / planned staffed time | Consistent schedule execution that supports forecast accuracy and protects service level |
First Call Resolution
FCR is the clearest test of whether the operation solved the problem or moved it along.
A low FCR rate usually shows up elsewhere before finance calls it out. Repeat contacts push volume higher, queues get longer, AHT rises on follow-up calls, and supervisors start hearing the same complaint themes again and again. In a nearshore environment, low FCR can also point to translation gaps, incomplete knowledge articles, or a handoff problem between front-line bilingual agents and back-office teams.
The operational question is simple. Which contacts should be one-and-done, and why are they not?
Billing disputes, password resets, order status checks, and basic troubleshooting should close on first contact if routing, permissions, and knowledge tools are set up correctly. If they do not, the issue often sits upstream from the agent. Policy friction, limited system access, poor callback ownership, and weak escalation paths are common causes.
Customer Satisfaction
CSAT measures the customer’s view of the interaction, not the manager’s view of efficiency.
That distinction matters. AHT can look healthy while CSAT drops because agents are ending calls before the customer feels confident the issue is resolved. In bilingual programs, blended CSAT can also hide a language-specific problem. English calls may score well while Spanish-language calls suffer from longer holds, weaker self-service content, or fewer tenured agents.
Review CSAT by intent, queue, and language. A single top-line number is too blunt to coach from.
Customer comments usually explain the trade-off behind the score. If customers mention waiting, review access and staffing. If they mention confusion, review knowledge design and agent communication. If they mention being transferred, return to FCR and routing logic.
Service Level
Service level is your access KPI. It shows whether customers can reach the team fast enough for the experience to start on stable ground.
The standard benchmark remains 80 percent answered within 20 seconds, based on Salesforce call center metrics benchmarks. That target is useful, but it should not be treated as universal. A utility outage line, a healthcare appointment desk, and a retail order-status queue do not carry the same urgency or the same tolerance for delay.
This KPI creates one of the most common trade-offs in call center management. Teams can protect service level by adding labor, but the extra cost may not be justified if FCR and CSAT are already strong. They can also miss service level while preserving margin, then pay for it later through higher abandonment, lower conversion, or poor survey results.
For practical reporting layouts, TimeTackle’s dashboard examples show how teams separate fast-moving operational metrics from broader management views.
Average Handle Time
AHT is an efficiency metric. It is also one of the easiest KPIs to misuse.
Handled well, AHT exposes process waste. Agents may be waiting on slow systems, opening too many screens, searching a weak knowledge base, or requesting approvals for simple exceptions. Those are operating model problems. They should not be framed as agent speed issues by default.
Handled poorly, AHT drives the wrong behavior. Agents rush the close, skip discovery, avoid education, or transfer too quickly. That lowers call time in the short term and raises volume later through repeat contacts and complaints.
Use AHT with context. Review it with QA, FCR, and CSAT in the same conversation. If you need a stronger benchmark for costing and staffing decisions, this guide on average handle time in call centers breaks down how the metric affects labor demand and margin.
Agent Adherence
Adherence is the control point that keeps the rest of the KPI set honest.
A center can have a solid forecast and still miss service level if agents are not where the staffing plan expects them to be. In bilingual operations, the consequences are more pronounced because one language queue may fail even while the total floor looks adequately staffed. Ten minutes of poor adherence on the English side is inconvenient. The same gap on a smaller Spanish queue can trigger long waits very quickly.
Adherence also has a real trade-off. Push it too hard and supervisors create a culture that treats people like schedule blocks. Attrition rises, flexibility disappears, and engagement drops. Let it slide too far and intraday management turns reactive.
The target should support reliability, not punish normal human variation. Strong operators coach patterns, not isolated minutes.
Building Your Practical KPI Dashboard
A KPI only matters if someone can see it in time to act.
Most weak dashboards fail in one of two ways. They either dump too much data onto one screen, or they report the right numbers too late. A useful dashboard separates real-time operational control from weekly coaching and monthly strategy.
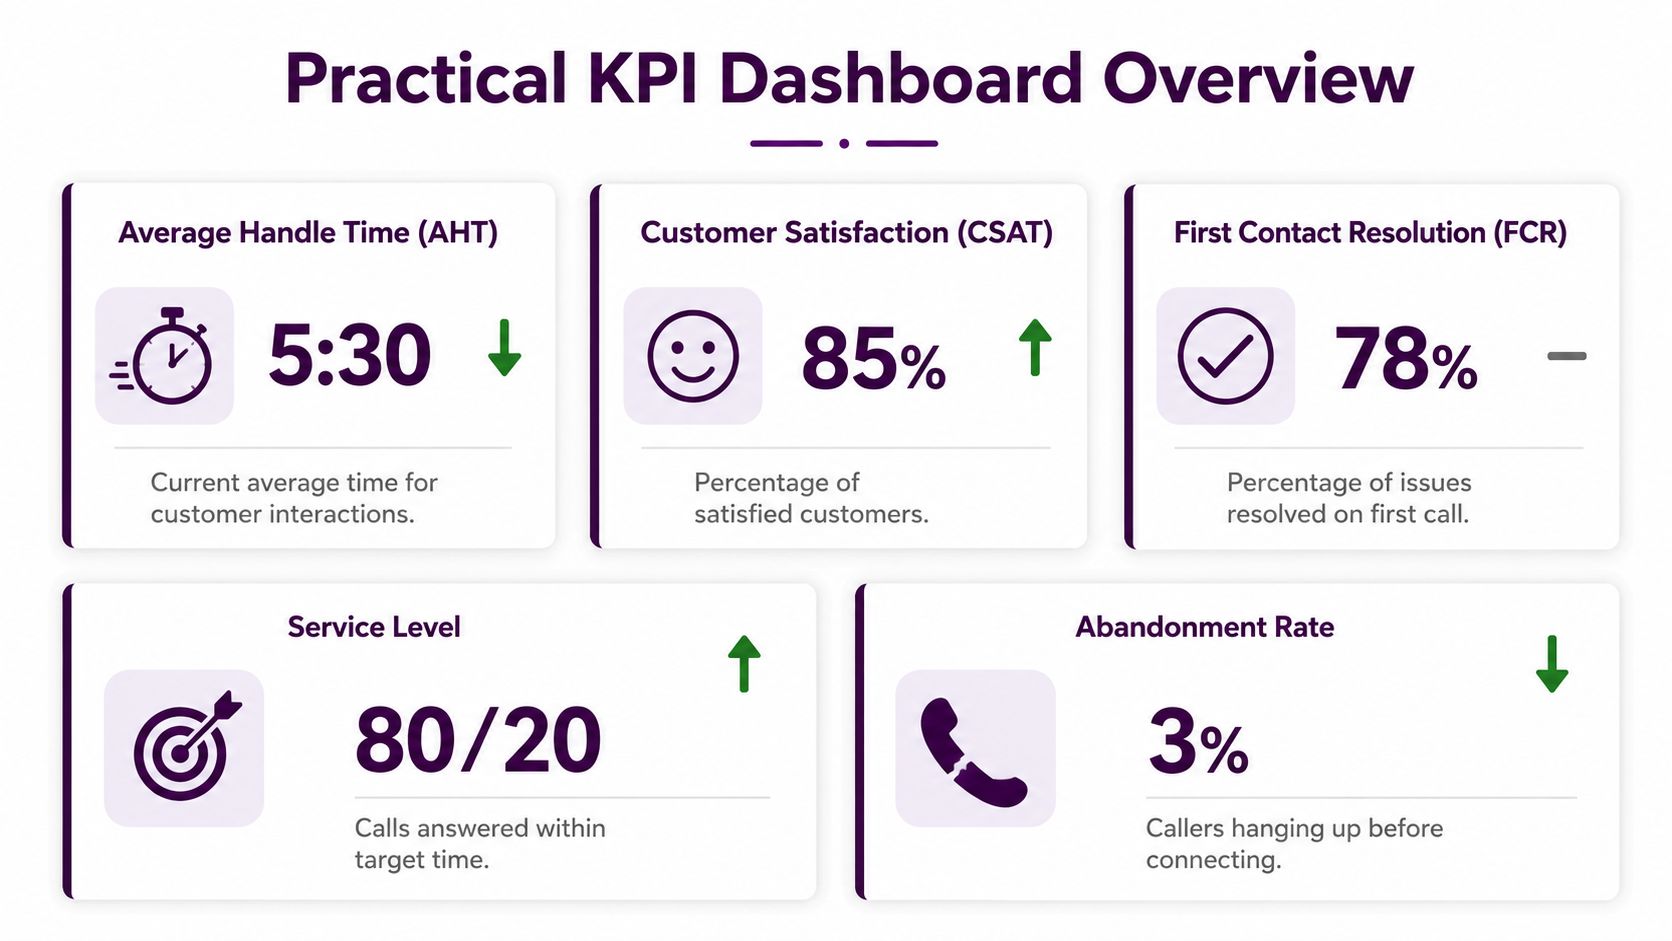
Match the KPI to the reporting cadence
A tiered monitoring approach works best. Daily monitoring should track Service Level, Average Speed of Answer, Abandonment Rate, and Agent Utilization, while CSAT, FCR, and quality scores should be reviewed weekly, according to Call It Dev’s guide to call center KPI monitoring.
That cadence makes operational sense.
- Daily metrics help you run the floor. These are the numbers that tell workforce teams and supervisors whether staffing, schedule execution, or queue performance needs immediate intervention.
- Weekly metrics help you coach. They reveal patterns that don’t show up in a single shift, such as whether one call type is dragging satisfaction down or whether one team resolves less effectively than another.
- Monthly metrics help executives decide. They encompass broader trends like cost per contact, attrition, or revenue impact.
What a useful dashboard should show
A practical dashboard should make it easy to answer three questions in under a minute:
- What’s happening right now?
- What’s drifting over time?
- Where should management intervene first?
That means each widget needs context, not just a number. Trend arrows, target lines, queue segmentation, and call-type views matter more than visual polish. If you want inspiration for clean layouts that communicate fast, TimeTackle’s dashboard examples are a solid reference for how to structure performance screens without overloading the viewer.
Practical rule: If a supervisor can’t tell whether the problem is staffing, process, or coaching within a quick scan, the dashboard needs simplification.
A floor-level example
Consider an e-commerce support team on a Monday morning. Service level drops, abandonment rises, and agent utilization tightens. That’s a same-day staffing and queue issue.
A week later, if CSAT is still soft and FCR slips for order-change calls, the problem probably isn’t just volume anymore. It may point to policy confusion, weak scripting, or a system workflow agents can’t operate smoothly. The dashboard should help you see that progression, not force you to guess.
The Art of Balancing Call Center KPIs
Are your KPIs improving the operation, or just shifting the pain from one metric to another?
That is where many scorecards break down. Leaders push one number hard, get the short-term lift they wanted, and then spend the next quarter cleaning up the side effects. In a nearshore, bilingual environment, that problem shows up faster because call complexity, language preference, and customer expectations are not evenly distributed across queues.
The clearest example is FCR versus CSAT. First Call Resolution is a strong metric, but it stops being useful when teams treat every closed contact as a true resolution. An agent can avoid an escalation, mark the case complete, and still leave the customer with an unresolved issue. The dashboard records a win. The customer remembers a bad experience.

When good numbers hide bad service
A technical support call makes the point. The agent gives a workaround, ends the contact, and protects handle time. The underlying system problem remains. The customer calls back the next day, now frustrated and less likely to trust the next agent. Yesterday’s FCR looked clean, but the operation created repeat demand.
AHT creates the same trap. If supervisors pressure teams to cut seconds at all costs, agents probe less, explain less, and document less. The queue may move faster for a week. Quality slips, callbacks rise, and coaching gets harder because the case notes are thin.
Segment by call type or the dashboard misleads
Blended averages cause bad decisions. Billing, technical support, retention, and compliance-heavy calls do not deserve the same target range. Neither do English and Spanish interactions in a nearshore call center model where language preference can affect talk time, clarification needs, and transfer patterns.
Use a practical lens:
- Billing calls should usually carry tighter AHT expectations and strong close rates.
- Technical support calls often justify longer handle time if deeper diagnosis prevents a repeat contact.
- Retention and complaint calls should give more weight to quality, save rate, and supervisor assist patterns than raw speed.
- Regulated call types need documentation accuracy and compliance adherence in the scorecard, even if that adds time.
One target across all of them creates false underperformance in some queues and false confidence in others.
Balance efficiency with workforce reality
A scorecard that rewards speed alone trains agents to act fast, not well. They interrupt more often. They skip context. They push difficult customers out of the queue through transfers or weak resolutions.
The people side needs to stay in view. Agent satisfaction, schedule adherence, shrinkage, attrition, and quality calibration results affect customer outcomes just as much as service level does. Ignore those inputs and the operation usually pays for it later through burnout, inconsistency, and higher hiring pressure.
If agents believe the scorecard punishes judgment, they will stop using judgment.
The better approach is to pair metrics so each one has a counterweight. Review AHT with CSAT. Review FCR with repeat contacts. Review service level with quality and occupancy. Review productivity with attrition and absenteeism. That structure keeps managers from solving one problem by creating two more.
Balanced KPI management is less about finding a perfect benchmark and more about choosing the right trade-off for the business. In practice, strong operators decide where they will accept a longer call, where they will demand faster closure, and where customer trust is worth more than a prettier dashboard.
KPI Considerations for Nearshore and Bilingual Operations
Are you reading bilingual call center KPIs in a way that reflects how the work happens?
Nearshore teams should still track the same core metrics as any other operation. The difference is how leaders interpret them. In a bilingual environment, a number that looks weak on a summary dashboard can reflect good service, better risk control, or a more complete resolution.
A common example is a Tijuana-based agent taking a call from a U.S. customer who starts in English, gets frustrated, then switches to Spanish to explain a billing dispute. The agent now has to calm the customer, confirm account details, explain policy in the customer’s stronger language, and document the case in the required system format. That interaction will often run longer than a simple English-only billing call. If it ends with a clear explanation, no repeat contact, and a satisfied customer, the extra minutes were well spent.

Where bilingual teams need a different lens
The main mistake is averaging everything together. Blended targets hide what is really happening across languages, call types, and customer expectations.
A better operating view includes a few nearshore-specific cuts:
- Track KPIs by language, queue, and issue type. Spanish retention calls, English tech support, and mixed-language billing calls should not share one AHT or FCR target.
- Review FCR with transfer rate and callback rate. In bilingual environments, a transfer may point to a skills gap, a routing problem, or limited agent authority. Those are different problems and they need different fixes.
- Audit quality for language clarity and cultural fit. A script can be technically correct and still sound stiff, vague, or overly literal to a U.S. Hispanic customer.
- Watch bilingual agent load. Agents who switch languages all day often show strain first in QA consistency, then in attendance, then in attrition.
The trade-off is straightforward. If managers push hard on handle time, agents will shorten explanations, transfer more often, or avoid checking understanding. If managers ignore efficiency, staffing costs rise fast. Nearshore leaders need targets that protect both resolution and labor economics.
For many programs, that means accepting slightly longer calls in exchange for stronger first-contact resolution and fewer repeat contacts. It also means being stricter about call flows, knowledge base design, and routing accuracy so agents do not waste time translating around bad process design.
Cultural alignment matters too. A customer calling from California may expect directness and speed. A customer who feels more comfortable in Spanish may respond better to a warmer opening and a fuller explanation before agreeing to the next step. Those differences affect CSAT, QA, and conversion outcomes. They should be coached deliberately, not treated as agent style.
This is one reason companies evaluating a nearshore call center model for bilingual customer support should ask to see KPI views segmented by language and contact reason, not just one blended scorecard. A dashboard that separates those realities is far more useful than one that makes the operation look simple.
From Metrics to Money How KPIs Drive Business Outcomes
What do your call center KPIs change in the business besides the dashboard?
The answer should be clear in three places. Retention, cost per contact, and revenue protection. If a KPI does not influence one of those outcomes, it probably does not belong in the leadership conversation.
In practice, the money story comes from combinations of metrics, not isolated scores. Higher first-contact resolution usually reduces repeat volume and lowers operating cost. Better QA usually improves compliance, reduces rework, and protects conversions. Strong service level helps preserve customer confidence at the start of the interaction, but pushing it too hard can inflate staffing cost without fixing the underlying reason customers call back.
That trade-off matters even more in a nearshore bilingual operation. A slightly longer handle time can be the right business decision if it produces better understanding, fewer transfers, and stronger resolution in English and Spanish. Chasing a lower AHT at all costs often creates hidden expense later through repeat contacts, lower CSAT, avoidable escalations, and agent burnout.
This is how experienced operators read the scorecard. CSAT points to retention risk. FCR points to both efficiency and loyalty. QA points to whether the team is protecting the brand while still moving work cleanly through the queue.
The strongest programs tie KPI reviews to financial questions. Which contact types create the most repeat volume? Which language queues need more tenured coverage because poor routing is driving transfers? Where are labor dollars rising without a matching gain in resolution or customer sentiment?
If you are evaluating support delivery with that level of discipline, this breakdown of the ROI of call center outsourcing gives a useful framework for connecting operating metrics to margin impact.
🚀 Build a KPI Framework That Drives Better Decisions
If you want a bilingual nearshore team that treats KPIs as business tools instead of dashboard decoration, CallZent can help. Our team helps North American companies build practical performance frameworks, improve visibility, and turn customer support into a stronger driver of retention, efficiency, and growth.
Talk to an ExpertIf you want a bilingual nearshore team that treats KPIs as business tools instead of dashboard decoration, talk to CallZent. Their team helps North American companies build practical performance frameworks, improve visibility, and turn customer support into a stronger driver of retention, efficiency, and growth.