

Performance Benchmarking
Performance Benchmarking for Call Centers: How to Compare What Matters
Learn how performance benchmarking helps call centers compare teams, vendors, KPIs, quality, cost, speed, and customer outcomes with cleaner data and better decision-making.
TL;DR — Quick Takeaways
- Performance benchmarking only works when teams define success the same way and compare data under consistent rules.
- The best benchmarks do more than track KPIs. They define the workload, standardize metrics, validate data, compare against a relevant reference point, and turn gaps into action.
- Call centers should group KPIs by decision type: service speed, quality, customer outcomes, and efficiency.
- Benchmarking should be a repeatable operating cycle, not a quarterly dashboard that gets reviewed once and forgotten.
- Nearshore partners like CallZent can help make benchmarking cleaner by aligning delivery, bilingual coverage, quality monitoring, and client-specific performance targets.
What good is a dashboard if your in-house team, nearshore partner, and outsourced vendor all define success differently?
That’s the trap many call centers fall into. They collect plenty of numbers, then compare results that aren’t truly comparable, which makes the meeting feel productive while the decisions stay fuzzy. Performance benchmarking only helps when the data is apples-to-apples, tied to real work, and consistent enough to trust.
TL;DR: Performance benchmarking is a repeatable way to compare your operation against a relevant reference point, spot gaps, and turn those gaps into action. The best benchmarks don’t stop at tracking KPIs, they define the workload, standardize the metrics, validate the data, and keep the comparison honest over time.
Why Most Call Centers Benchmark the Wrong Things
What if the problem isn’t that you don’t have enough data, but that you’re comparing the wrong things?
That question matters in call centers because the same KPI can mean different things in different teams. One supervisor may count a resolved case one way, another may use a different wrap-up rule, and a vendor may report on a different time window altogether. When the definitions drift, the benchmark stops being a decision tool and becomes a reporting exercise.
The real issue is comparability
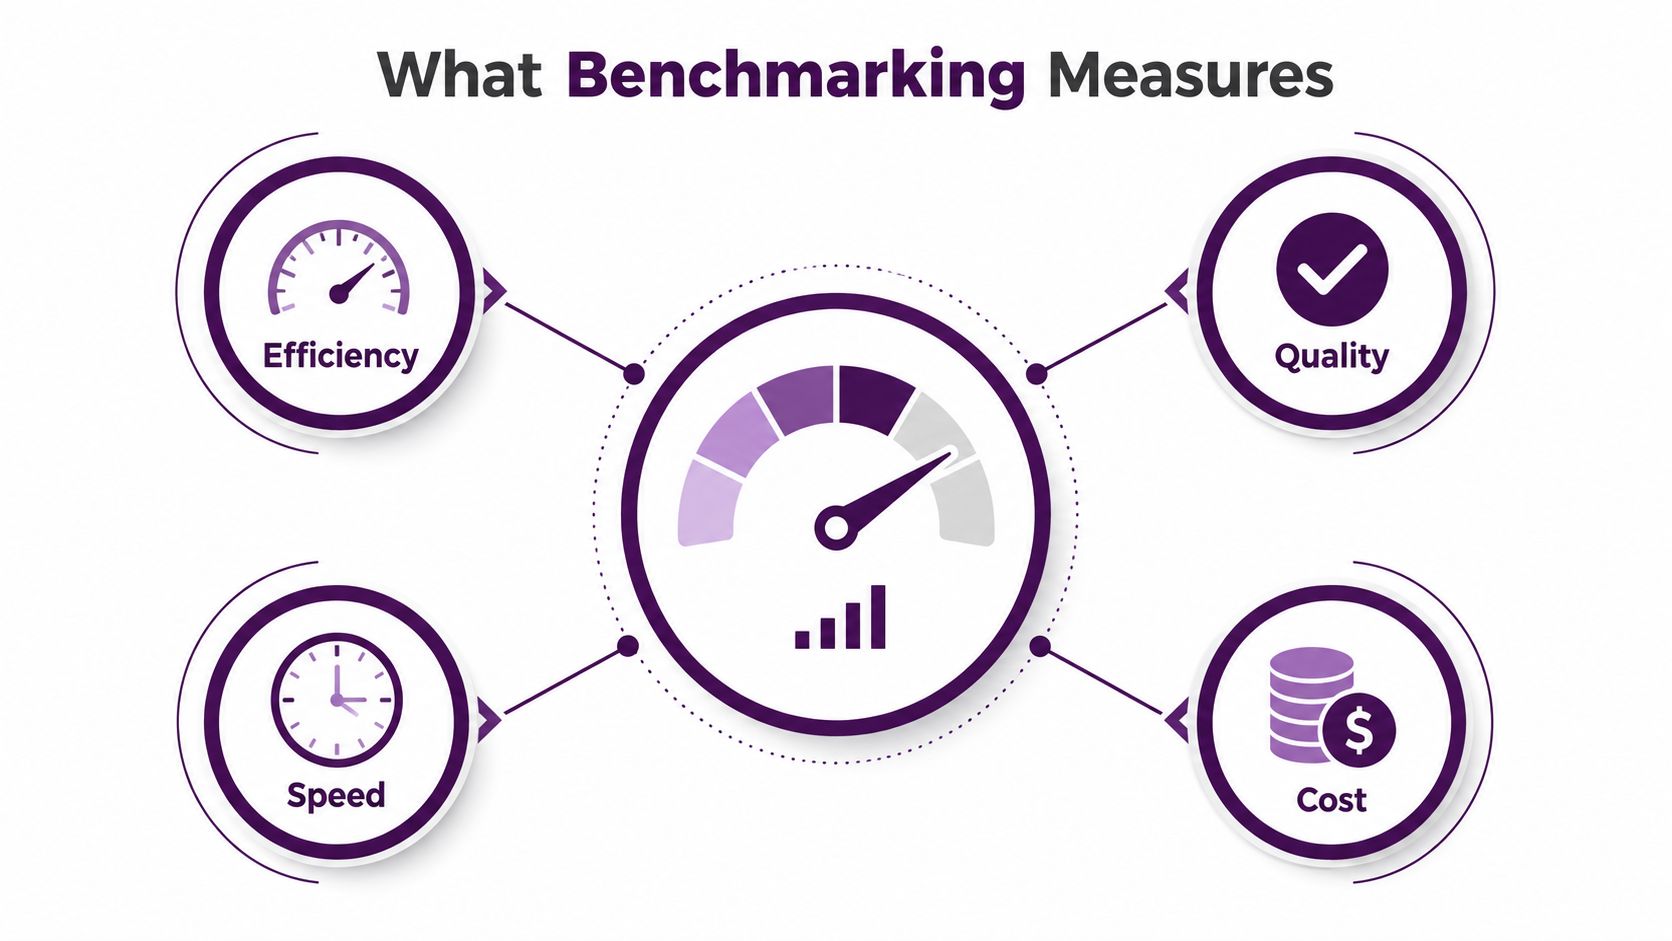
Benchmarking became a formal discipline in the late 1970s and 1980s, when companies started comparing their processes against external best-practice organizations instead of relying only on internal targets. Its core dimensions are still quality, time, and cost, and the whole point is to find the gap between current performance and a reference point you can learn from. In call center work, that means comparing like with like, not just ranking teams on a dashboard.
Practical rule: If two teams don’t use the same definition, time period, and data source, their numbers are not ready for a benchmark.
That’s why the most useful benchmark starts with a baseline, then adds comparison data, gap analysis, and an action plan. It’s a cycle, not a one-off report. If you want a practical example of how targets connect to service delivery, the framework on performance targets for customer service is a useful companion reference.
Better questions lead to better decisions
A lot of teams ask, “How are we doing?” That’s too broad. A better question is, “How are we doing compared with a defined peer group, under the same rules, on the same workload?” That shift changes the conversation from opinion to evidence.
The strongest benchmark comparisons also separate signal from noise. A small team may look great in isolation but struggle when volume spikes, while a larger team may look average on a simple chart but perform better under real operating pressure. In a multi-site or outsourced environment, that difference matters because your job is to run the business, not just admire the report.
What Performance Benchmarking Actually Means
A fitness tracker only helps when you know the reference point. Step counts mean one thing for a marathon runner, another for a warehouse associate, and something else again for someone recovering from an injury. Performance benchmarking works the same way because a raw number only becomes useful when you place it beside a comparison that fits the job, the workload, and the operating context.
The working definition
The U.S. National Academies describes benchmarking as a systematic method for measuring performance against recognized leaders so you can identify best practices and adapt them for improvement. That definition matters because it shifts the focus from simple ranking to learning. You are not only asking who scored higher. You are asking what the stronger performer does differently, and whether that difference can be applied in your own operation. The National Academies definition of benchmarking makes that distinction clearly.
In practical terms, benchmarking usually compares quality, time, and cost. In a contact center, those may show up as issue resolution quality, response speed, and labor or handling cost. The comparison is only trustworthy when those dimensions are tied to the same workload, the same baseline, and the same rules for measurement.
Regional labor markets can shift those comparisons in ways that are easy to miss. A LATAM web design compensation guide is a useful reminder that pay and market conditions vary by region, so two teams can look different on paper even when they are doing similar work.
Static reports versus an operating system
Many teams treat benchmarking like a quarterly snapshot. That misses the core value. Contemporary benchmarking guidance describes a repeating loop: collect baseline data, compare, analyze the gap, implement changes, and review again. That cycle is what turns benchmarking into part of performance management instead of a report that gets read once and filed away.
Key takeaway: A benchmark is not a trophy. It is a decision rule.
A trustworthy benchmark tells you whether a result is good, whether it is good for the workload being handled, and whether it is stable enough to rely on. If the comparison is not linked to those questions, it may still be informative, but it is not management-grade.
The Main Types of Benchmarking and When to Use Each
Different problems call for different comparisons. A team trying to improve average handle time needs a different lens than a leader trying to compare two channels or two regions. The trick is knowing which benchmark type gives you a useful answer instead of a noisy one.

Internal benchmarking works best when the comparison is already close
Internal benchmarking compares one part of your own operation to another. In a call center, that could mean comparing a morning shift with an evening shift, or one site with another site that handles the same queues. It’s often the fastest place to start because the data sources and definitions are usually easier to align.
Competitive benchmarking is for market-facing questions
Competitive benchmarking compares your operation with competitors or peers in the same market. Use this when you need to understand where your service stands in the broader market, especially on visible outcomes like response quality or customer experience. This type is helpful, but only if you can get reliable outside data, which isn’t always easy.
Functional benchmarking helps you borrow from a different industry
Functional benchmarking compares a process with a strong performer in another industry. A call center might look at how a retail support team handles seasonal spikes, or how a healthcare intake team structures scheduling triage. The advantage is that you can borrow a process idea even when the business model is different.
Generic benchmarking is useful for common operating problems
Generic benchmarking looks at a shared process, like staffing, queue routing, or escalation handling, regardless of industry. It’s useful when the process itself is the same even if the customer base isn’t. For outsourced and nearshore teams, this can be a practical way to compare work across clients without forcing an artificial industry match.
The National Academies’ definition matters here because it frames benchmarking as learning from superior performers, not just ranking names on a list. That’s the value when you’re deciding whether to compare internally, competitively, functionally, or generically.
A Repeatable Methodology You Can Actually Run
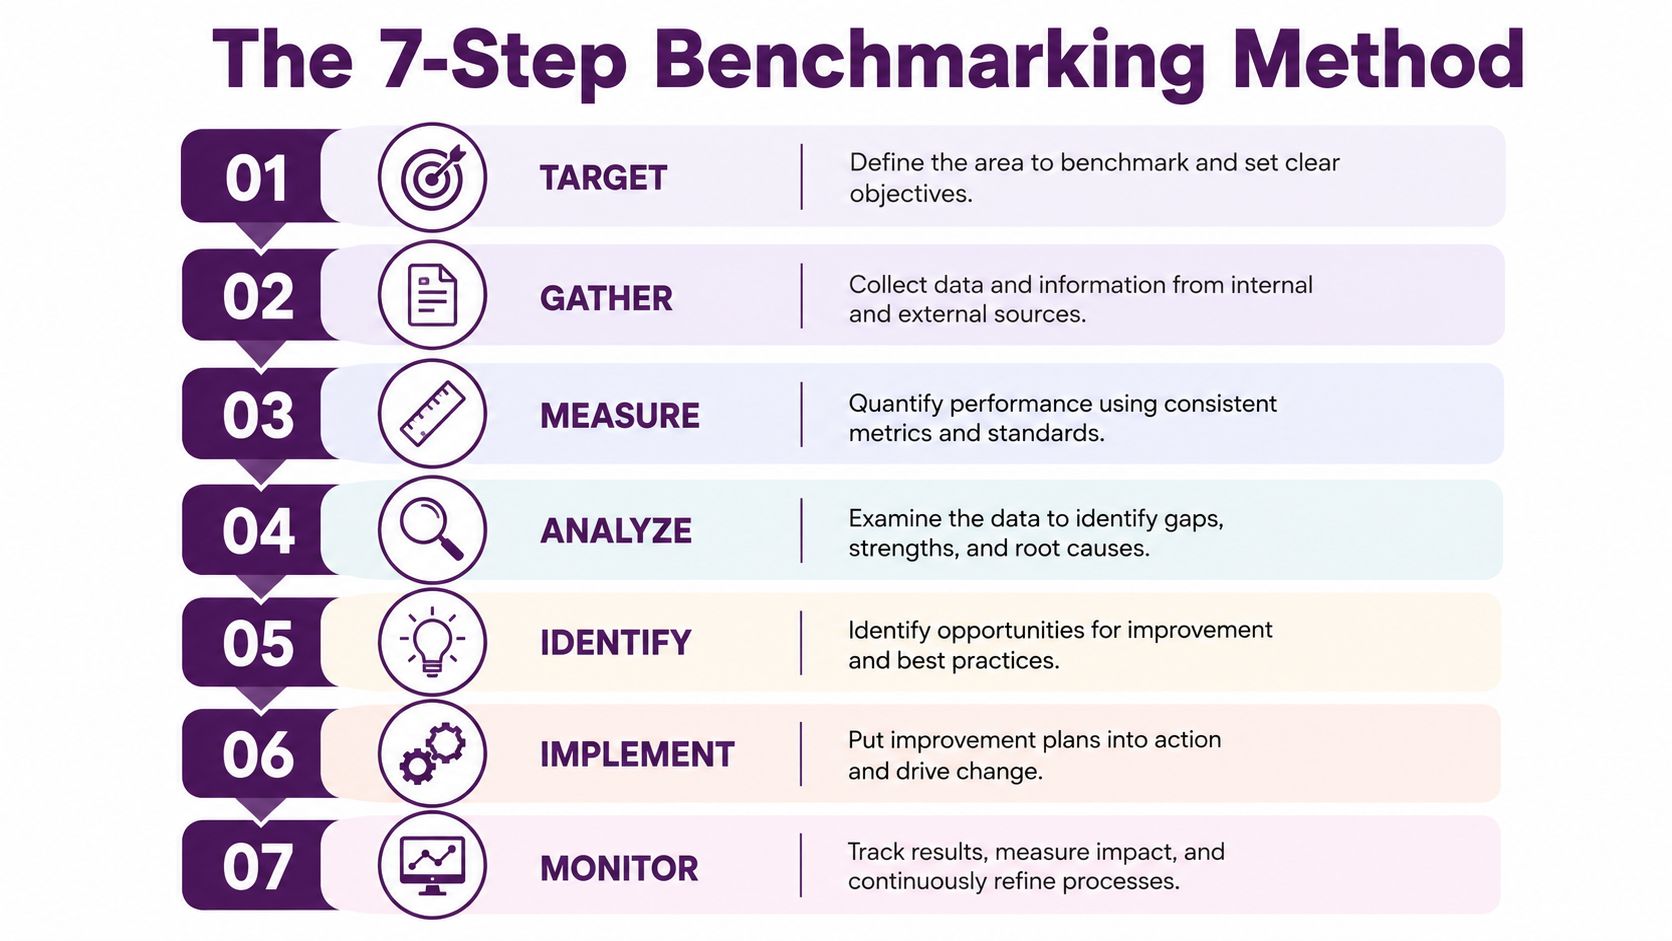
A benchmark only helps if the process is disciplined enough to survive scrutiny. The UK government’s benchmarking guide lays out a seven-step method, and it maps well to contact center operations because it forces clarity before comparison. The official benchmarking guide is especially useful because it treats benchmarking as a structured cycle, not a loose spreadsheet exercise.
Start with the objective, not the dashboard
Define the business question first. Are you trying to improve service responsiveness, reduce handling cost, or compare two teams that serve the same customer type? Once the objective is clear, choose only the metrics that answer that question.
Break the operation into measurable pieces
A call center is not one number. It’s queue routing, staffing, agent behavior, wrap-up work, QA, escalation handling, and customer follow-through. If you don’t separate those components, you can’t tell which part caused the gap.
Build the template before you gather the data
Data-gathering templates keep teams from reporting the same metric differently. That’s where many benchmarks fail. The health-center guidance in the verified research warns that consistency in ratio definitions and calculation rules matters more than piling on extra measures, and that’s true in contact centers too.
Validate, re-base, and compare
Before you compare, validate the source and re-base the figures so they’re directly comparable. The UK guidance also notes that benchmark data can be combined into a single summary figure, but only after the underlying components are clean. Use that structure carefully, because a single score is only useful when the inputs are solid.
Practical rule: Benchmarking gets weaker when teams add more metrics but don’t tighten the definitions.
If you want a practical companion on measuring team-level execution, performance management best practices can help connect the benchmark to day-to-day coaching. The goal is simple, define the question, standardize the inputs, and repeat the cycle on a schedule you can sustain.
The KPIs That Actually Matter in a Call Center
A lot of teams track too many KPIs and still can’t answer a basic question: where is performance really breaking? The answer usually isn’t “nowhere.” It’s that the dashboard mixes service, quality, outcome, and efficiency metrics without telling leaders which bucket matters most.
Group the KPIs by decision type
Service and responsiveness metrics tell you how quickly the team responds and how well it keeps pace with demand. Quality metrics tell you whether the answer was right, complete, and consistent. Customer outcome metrics tell you whether the contact solved the problem. Efficiency metrics tell you how much effort it took to get there.
That grouping matters more than the metric list itself. A team can look fast and still frustrate customers. Another can look slower and still perform better if it resolves issues correctly the first time.
Sample KPI Benchmark Ranges for Call Centers
| KPI | What It Measures | Typical Range | Why It Matters |
|---|---|---|---|
| First Contact Resolution | Whether the issue is solved in one interaction | Varies by operation | Shows whether the team solves problems instead of recycling them |
| Average Speed of Answer | How quickly calls are answered | Varies by queue and staffing model | Helps spot staffing gaps and queue pressure |
| Hold Time | How long customers wait during a call | Varies by process complexity | Too much hold time often signals routing or knowledge issues |
| Quality Score | How well agents follow process and resolve the issue | Varies by QA rubric | Measures consistency, compliance, and customer experience |
| Transfer Rate | How often calls are moved to another queue or agent | Varies by workflow | High transfer rates can signal weak training or poor routing |
| Average Handle Time | Total time spent handling a contact | Varies by contact type | Useful only when paired with quality and outcome |
| CSAT | Customer satisfaction after the interaction | Varies by survey design | Shows whether the service feels effective to customers |
| Cost per Contact | The cost to handle one interaction | Varies by labor model | Helps leaders balance service quality with operating cost |
The point of this table is not to pretend there’s one universal target. The verified guidance is clear that benchmarking should be tied to a specific workload and practical operating context. That’s why fewer well-defined metrics usually beat a crowded dashboard.
Use a tight metric set
The health-center benchmarking guidance recommends tracking only 5-10 metrics, and that advice fits call centers well. When leaders track too much, they lose the thread between signal and action. When they track a smaller set of well-defined KPIs, they can see whether the problem is speed, quality, customer outcome, or cost.
For a deeper KPI framework, CallZent’s call center KPI guide is a useful internal reference point. The right question isn’t “How many KPIs can we show?” It’s “Which few numbers really change our decisions?”
Turning Numbers Into Decisions With Better Visuals
A benchmark can be technically correct and still be useless if the chart hides the story. Averages are the usual culprit. They flatten out spikes, hide instability, and make two teams look more similar than they are.
Show the spread, not just the midpoint
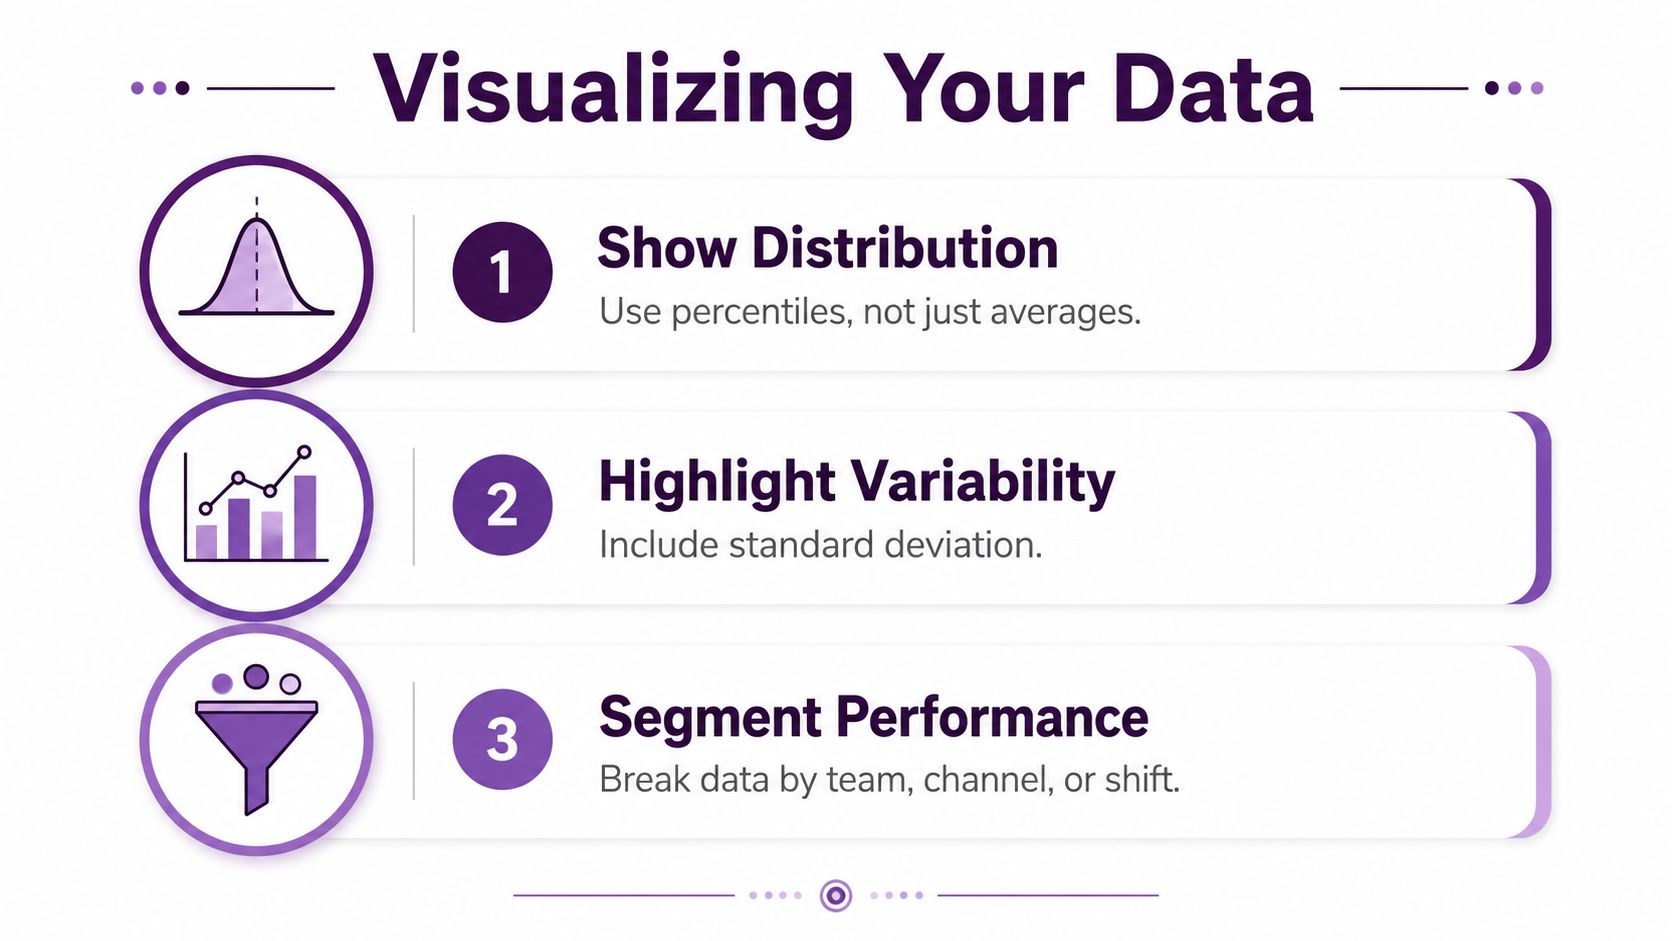
If a benchmark only shows an average, you can miss tail problems. The verified guidance on presenting benchmark data recommends including standard deviation, confidence intervals, and percentiles, because averages alone can hide unstable behavior under load. That matters in call centers where a few bad interactions can distort customer experience.
Put throughput and latency on the same page
Another common mistake is treating throughput and latency like separate stories. They’re usually a trade-off. A team may handle more volume, but the customer may wait longer or experience slower resolution.
A useful chart shows both metrics side by side and adds a threshold line tied to the SLA. That’s the difference between a performance report and a decision tool. If you want a practical tie-in to business value, the LeaveWizard ROI guide is a good reminder that measurement only matters when it connects to operational outcomes.
Segment the result before you judge it
Averages across the whole center can hide what’s happening by team, channel, or shift. Break the data apart before drawing conclusions. A night shift may outperform the day shift on accuracy, while the day shift may win on speed because it has better staffing or easier contacts.
Key takeaway: If a chart doesn’t reveal a trade-off, it’s probably not showing enough detail.
The Statsig guidance on benchmarking against real-world behavior makes the same point in another way, the benchmark should reflect actual usage, not an artificial load test. In a call center, that means your visuals should help managers see real operational differences, not just decorate a monthly slide deck. For reporting structure, CallZent’s dashboards and metrics overview is a useful internal complement.
How CallZent Builds Benchmarking Into Daily Operations
A good nearshore partner makes benchmarking cleaner, not messier. Shared time zones, cultural proximity, and bilingual coverage reduce the distortion that often shows up when teams are spread across mismatched schedules and uneven customer contexts. That makes comparisons easier to trust because the operation is built around a more consistent service environment.
Benchmarking works better when the service model is stable
In Tijuana, a bilingual nearshore setup can support U.S.-facing operations with fewer handoff gaps between English and Spanish work. That consistency helps when a client wants to compare teams, sites, or channels without fighting wildly different operating conditions. It also helps when the same queue serves multiple customer segments that need the same standard of care.
Targets should be built with the client, not handed down after the fact
The strongest operating rhythm starts during onboarding, continues through quality monitoring, and gets reviewed in quarterly business reviews. That’s where a partner can align the benchmark to the client’s actual goals instead of forcing a generic industry target onto a specific workflow. The quality monitoring approach matters here because benchmark quality depends on what gets observed, scored, and coached.
Healthcare, finance, and e-commerce teams all need different control points, but the benchmark logic stays the same. Define the workload, lock the metric definitions, compare against a relevant reference, and keep the review cycle moving.
Practical rule: A benchmark is only useful when the people running the operation believe the comparison is fair.
That’s the advantage of embedding benchmarking into the operating rhythm. Clients don’t just get reports. They get a process that makes the numbers usable, repeatable, and tied to service decisions.
🚀 Turn Benchmarking Into a Working Management Habit
If you’re ready to turn benchmarking into more than a monthly spreadsheet, CallZent can help you build a cleaner comparison model for your support operation with nearshore delivery, bilingual coverage, and disciplined quality tracking.
Talk to an ExpertIf you’re ready to turn benchmarking into a working management habit instead of a monthly spreadsheet, CallZent can help you build a cleaner comparison model for your support operation. Visit the team to see how nearshore delivery, bilingual coverage, and disciplined quality tracking can give you numbers you can use.